-
Interactive DashboardsCreate interactive BI dashboards with dynamic visuals.
-
End-User BI ReportsCreate and deploy enterprise BI reports for use in any vertical.
-
Spreadsheet AnalyticsNewLast-Mile Analytics Tool.
-
Narrative Data StoriesThe Next Evolution of Data Storytelling
-
Automated Business DocumentsNewDocument Generation for Smarter Workflows
-
Visual Data Pipeline BuilderDesign Complex Data Flows, Simply.
-
Wyn ArchitectureA lightweight server offers flexible deployment.
-
 Wyn Enterprise 7.1 is ReleasedThis release emphasizes Wyn document embedding and enhanced analytical express...
-
 Choosing an Embedded BI Solution for SaaS ProvidersAdding BI features to your applications will improve your products, better serve your customers, and more. But where to start? In this guide, we discuss the many options.
-
Visual GalleryInteractive sample dashboards and reports.
-
BlogExplore Wyn, BI trends, and more.
-
WebinarsDiscover live and on-demand webinars.
-
Customer SuccessVisualize operational efficiency and streamline manufacturing processes.
-
Knowledge BaseGet quick answers with articles and guides.
-
VideosVideo tutorials, trends and best practices.
-
WhitepapersDetailed reports on the latest trends in BI.
-
 Choosing an Embedded BI Solution for SaaS ProvidersAdding BI features to your applications will impr...
-

You probably know what you want your dashboard to tell you before you know what it should look like.
How many support tickets are coming in? How long does it take to resolve them? Which areas need more attention?
Those are straightforward questions. Turning them into a dashboard usually involves a few more decisions: choosing charts, assigning data fields, setting calculations, and arranging everything.
With Wyn Enterprise’s AI Chat Analysis, you can start with the questions themselves.
In this walkthrough, we’ll use eleven questions to build an interactive IT help desk dashboard, then customize its appearance. It’s the same workflow shown in the accompanying video, from the first KPI to the final saved dashboard.
To create a dashboard with AI in Wyn Enterprise, start with a prepared dataset or data model, ask a question in natural language, review the generated visualization, and select Add to Dashboard. Repeat for the metrics you need, then customize and save your dashboard.
What does conversational AI bring to dashboard creation?
In Wyn’s dashboard designer, you can choose a visualization and drag data fields into properties such as values, axes, and legends. That gives you control over how each chart is built.
AI Chat Analysis gives you another way to get started: describe what you want to know in everyday language. It uses natural-language queries to generate visual answers from your connected data.
For an IT help desk manager, that means starting with “What is the average resolution time in days?” rather than configuring the visualization first.
You still decide which questions matter. You can review each answer, change the visualization, and choose what belongs on the dashboard.
Step 1: Start with the data and a clear purpose
The demonstration begins with IT help desk data ready to analyze. The questions cover ticket counts, resolution times, requestors, agents, satisfaction levels, and functional areas.
Before asking the AI to build anything, decide what the dashboard should help someone understand.
For this example, the purpose is to give a help desk manager a clear view of workload and service performance:
- How much work is coming in?
- How quickly is the team resolving it?
- Where should the manager investigate further?
Your dataset needs to contain the information required to answer those questions. It also helps to agree on definitions beforehand. Does “resolution time” mean calendar days or working days? What qualifies a ticket as critical?
Clear definitions make it easier to judge whether a result answers the question you intended to ask.
Step 2: Ask your first question
Start with a simple measure:
“What is the total number of tickets?”
In the video, Wyn processes the question, examines the dataset schema, and selects a suitable visualization.
Review the result. If you prefer a different presentation, you can change the visualization before adding it.
Then click Add to Dashboard.
That gives you your first dashboard component. The rest of the process follows the same pattern: ask, review, and add.
Step 3: Build the overview with five key metrics
A help desk manager opening this dashboard needs a quick sense of scale before looking at the details.
The first five questions establish that overview:
- What is the total number of tickets?
- What is the average resolution time in days?
- What is the total number of critical tickets?
- How many unique requestors are there?
- How many agents are there?
Together, these metrics show the volume of work, the time needed to resolve it, and the people involved.
They also give the charts that follow some context. A rise in resolution time is easier to investigate when you can also see ticket volumes and the number of agents represented in the data.
Step 4: Add the questions that reveal patterns
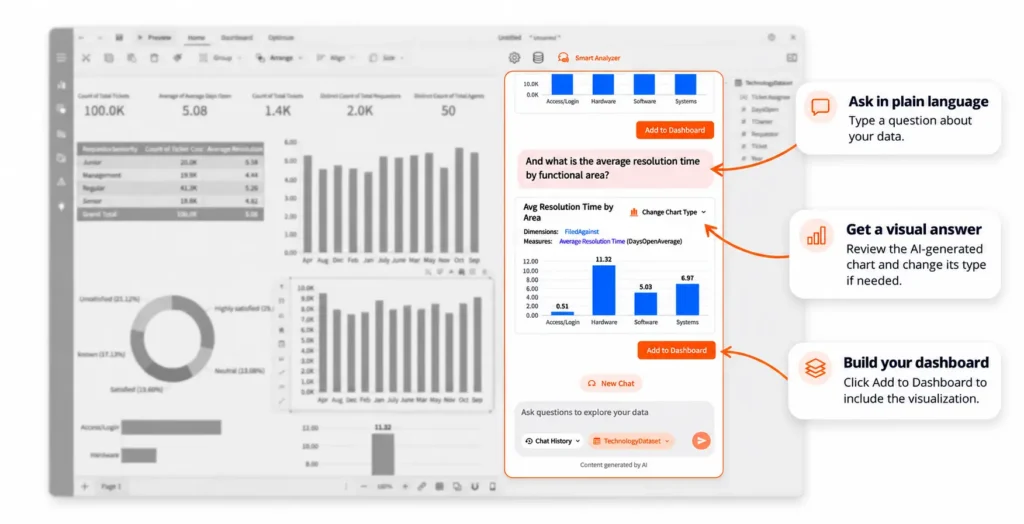
The remaining six questions take the dashboard beyond headline numbers:
| Question to ask | What it helps you explore |
|---|---|
| What is the number of tickets and the average resolution time in days by requestor seniority? | How ticket volume and resolution time vary across requestor groups. |
| What is the average resolution time by month? | How resolution time changes over time. |
| What is the percentage breakdown of tickets by satisfaction level? | How tickets are distributed across satisfaction categories. |
| How many tickets are there each month? | Monthly changes in help desk demand. |
| How many tickets are there by functional area? | Which areas account for the most tickets. |
| What is the average resolution time by functional area? | Which areas have longer or shorter resolution times. |
After each question, review the generated visualization and add it to the dashboard.
The value comes from seeing these answers together. For example, if one functional area has longer resolution times, its ticket volume gives you another piece of the picture. A high workload might be worth investigating, but the dashboard alone does not establish the cause.
That’s where useful analysis begins: with a pattern that helps you decide what to examine next.
Step 5: Make the dashboard easy to read
Once all eleven questions have been answered, the dashboard has its core content. Now give that content a clear visual order.
In the demonstration, you can change the theme and background, edit titles, adjust the X and Y axes, and customize the visualizations.
A sensible layout for this example would put the headline metrics at the top, monthly trends beneath them, and the detailed breakdowns further down.
Use titles that tell readers exactly what they’re looking at. “Average Resolution Time by Month” is more useful than “Monthly Performance,” especially when someone is seeing the dashboard for the first time.
Keep units visible, too. If resolution time is measured in days, readers should not have to guess.
Step 6: Explore, check, and save
The finished dashboard brings the help desk metrics and charts into one interactive view.
Users can explore the data further using the dashboard’s available interactions. Before saving, check that the figures, labels, and time periods match the intended analysis.
A few practical checks help:
- Confirm that ticket counts use the intended counting method.
- Check that resolution time uses the agreed definition and unit.
- Review how missing satisfaction values are handled.
- Make sure the charts cover the date range you want to analyze.
Then save the dashboard.
The video demonstrates how quickly this workflow can come together with prepared data. The time needed for another dashboard will depend on the data, the questions, and the amount of customization required.
Better questions make a more useful dashboard
You don’t need an elaborate prompt to ask for a ticket count. More complex questions benefit from a little precision.
Compare “Show me resolution time” with “What is the average resolution time in days by functional area?”
The second question specifies the calculation, unit, and grouping. That gives you a clearer result to review.
It also helps to build the dashboard around decisions.
Eleven questions work for this demonstration. Your dashboard might need fewer.
See the workflow in action
A useful dashboard starts with knowing what you need to understand.
In this IT help desk example, eleven everyday questions become a set of KPIs and visualizations that users can explore together. AI helps create the components, while you choose the questions, review the answers, and shape the final dashboard.
Watch the accompanying video to follow the full process, or explore Wyn Enterprise’s AI Chat Analysis to learn more.
Frequently Asked Questions
How do I create a dashboard with AI in Wyn Enterprise?
Start with a prepared dataset or data model, ask a question in AI Chat Analysis, review the generated visualization, and click Add to Dashboard. Repeat for the other metrics and charts you need, then customize and save the dashboard.
Do I need to write SQL to follow this workflow?
The workflow shown in the video uses natural-language questions rather than manually written SQL. Your underlying data must already be available for analysis.
Can I change the charts generated by AI?
Yes. In the demonstrated workflow, you can change the generated visualization. You can also customize dashboard elements such as titles, themes, backgrounds, and axes.
Can AI create an entire dashboard from one prompt?
This demonstration builds a dashboard one question at a time. Each answer becomes a component that the user reviews and adds to the dashboard. It does not demonstrate creating the entire dashboard from a single prompt.
How long does it take to create an AI dashboard?
The video demonstrates dashboard creation in minutes using prepared IT help desk data. Your timing will depend on data readiness, the complexity of your questions, and the customization you need.
Your Next Dashboard Starts with a Question
See how Wyn Enterprise turns everyday questions into interactive charts and KPIs. Watch the video and follow along to build your own dashboard with AI Chat Analysis.
Request a Personalized Demo of Wyn Enterprise →

Enea Gega
Enea is a Technical Product Enablement Specialist for the Wyn Enterprise Platform. He acts as a vital bridge between customers, product teams, and engineering to ensure that every new feature delivers genuine value and drives user adoption.
Enea specializes in translating complex customer needs into actionable insights for product roadmaps and technical documentation. By partnering cross-functionally, he ensures seamless delivery readiness and alignment across all releases.


Loved by industry
experts and real users


