-
Interactive DashboardsCreate interactive BI dashboards with dynamic visuals.
-
End-User BI ReportsCreate and deploy enterprise BI reports for use in any vertical.
-
Wyn AlertsSet up always-on threshold notifications and alerts.
-
Localization SupportChange titles, labels, text explanations, and more.
-
Wyn ArchitectureA lightweight server offers flexible deployment.
-
 Wyn Enterprise 7.1 is ReleasedThis release emphasizes Wyn document embedding and enhanced analytical express...
 -
 Choosing an Embedded BI Solution for SaaS ProvidersAdding BI features to your applications will improve your products, better serve your customers, and more. But where to start? In this guide, we discuss the many options.
-
Embedded BIEmbed reporting & analytics within your own custom apps.
-
Self-ServiceEnable users to create custom ad hoc reports and dashboards.
-
MultitenancyEnhance your SaaS apps with a multitenant BI platform.
-
Data Governance and ModelingTransform raw data into insights quickly to reveal trends.
-
Scheduled DistributionSend data insights via scheduled email and chat notifications.
-
Extensible SecurityWyn delivers extensible security for your access control needs.
-
Visual GalleryInteractive sample dashboards and reports.
-
BlogExplore Wyn, BI trends, and more.
-
WebinarsDiscover live and on-demand webinars.
-
Customer SuccessVisualize operational efficiency and streamline manufacturing processes.
-
Knowledge BaseGet quick answers with articles and guides.
-
VideosVideo tutorials, trends and best practices.
-
WhitepapersDetailed reports on the latest trends in BI.
-
 Choosing an Embedded BI Solution for SaaS ProvidersAdding BI features to your applications will impr...
 -

Creating Business Intelligence Dashboards (Video)
Embedded BI is the integration of BI solutions within business process software. Embedded BI provides end-users the ability to create compelling dashboards and professional reports easily.
Embedding interactive BI dashboards into your standard workflow provides critical to day-to-day operations and long-term strategic planning — this is especially beneficial for non-technical end-users that can utilize embedded, self-service capabilities. Self-service BI enables many users to be more productive because it involves solutions that are easier to use, do not require coding, and do not require IT to set up all data access, queries, visualizations, and preparation.
Why You Should Use BI Dashboards:
- To monitor business performance in order to discover the story behind your data
- Dashboards allow customization specific to the intended audience (analysts, C-level, etc.)
- To highlight and communicate key data points (KPIs)
- Allows you and your team to identify opportunities
- Enables the use of self-service BI applications by industry analysts, managers, and employees
- Enables you to make data-driven informed decisions

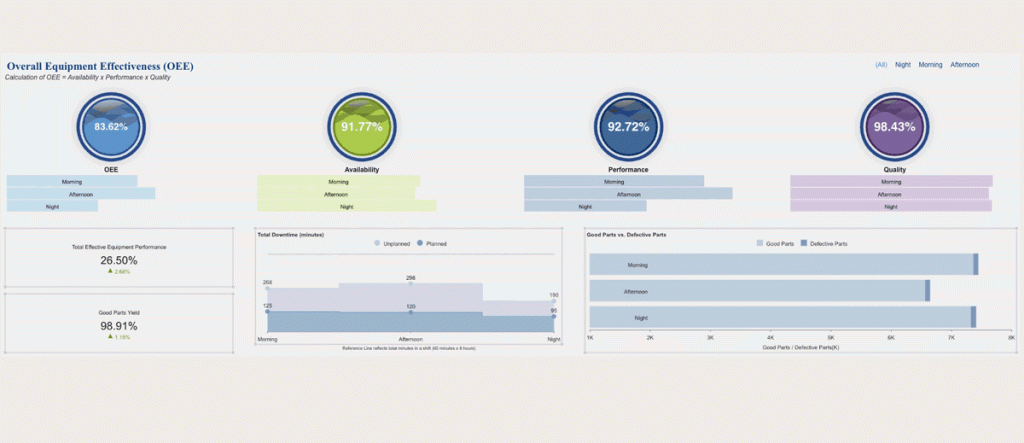
Manufacturing OEE Dashboard by Wyn Enterprise
With Wyn Enterprise, you can quickly and easily build high-value, interactive, and drillable business intelligence dashboards. The Wyn Enterprise Dashboard Designer allows users to create interactive dashboards by connecting to a data source, setting up the UI, previewing, and then exporting the dashboard.
In this video, we will go through the Wyn Dashboard Designer’s features and functionalities.
Wyn Enterprise Dashboard Designer Walkthrough
Wyn dashboards display information through a series of interactive tiles that contain:
- Data visualizations
- Custom visualizations
- Components
- Slicers
Data Visualizations Tile
In the Data visualizations tile, Wyn provides and supports over thirty chart types such as Area, Range, Column, Line, Pie, Bar, Combined, Polar, Radar, Statistical and Specialized charts such as Calc Charts.
Data Binding Tab
When dragging a visualization onto the design area, the data binding tab will automatically be shown.
The Data Binding Tab is where datasets are bound to visualizations and slicers in the dashboard. Once the data is bound, users can easily drag and drop the fields from the dataset to visualize their data on the dashboard.
Inspector Tab
Users can then use the Inspector Tab to configure settings such as color palette, data labels, fonts, and more. Other properties can either be searched with the components search bar or found easily in the labeled sections of the tab.
The Inspector Tab can be used to customize settings for the selected data visualization, component, slicers, and the dashboard page, itself.
Custom Visualization Tile
This brings us to the Custom visualization tile. Wyn provides end-users custom endless visualization possibilities, enabling you to implement your unique visualization demands. Create and add your own visualization plugins in Wyn Dashboards.
Components Tile
The Components tile includes containers, rich text, and images which can be added to customize any dashboard.
Slicers Tile
The Slicers tile includes a label slicer, multidimensional slicers, data range slicers, and date slicers.These enable users to slice and dice any dashboard.
Page Tab
These tiles can be pinned to the sidebar to quickly access the visualizations, components, and slicers.
At the bottom of the dashboard designer, you will see the Page Tab. This is where users can add a new dashboard page, to smoothly go back and forth from one dashboard page to another.
Interaction Setting
The Interaction setting enables visualizations that are using different datasets to interact if they have a common field. The interaction setting can be helpful when using a slicer to filter all charts in a dashboard, even if they have separate datasets.
Show Grid Line
The Show Grid Line allows users to view grid lines on their dashboard for precise placement of all dashboard components.
Enable Overlap
Enable Overlap enables components of the dashboard to overlap each other.
Snap Setting
The Snap setting displays the options, Snap to Grid and Snap to Guides. These options enable users to place their visualizations, slicers, and components perfectly on the dashboard.
Mobile Designer
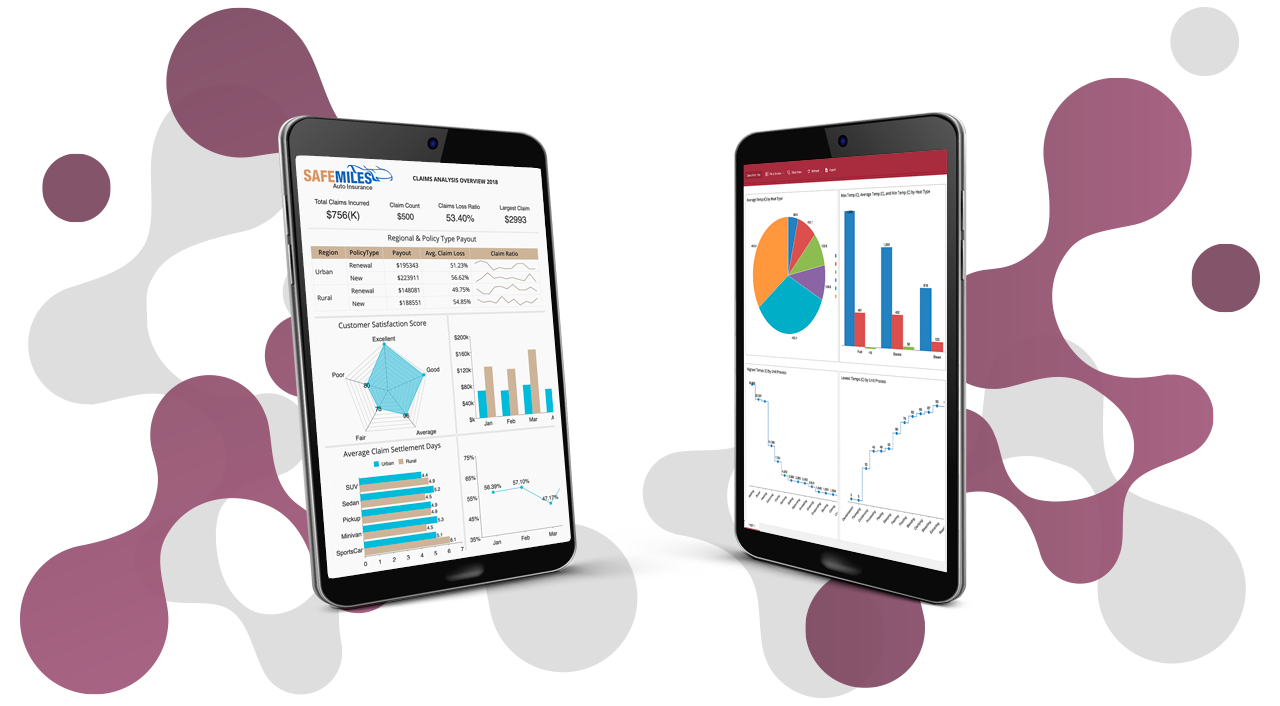
The Mobile Designer enables users to view and edit the layout of the dashboard for a mobile view. End-users can create a custom layout for the mobile view or use the auto layout option.
At any time in the Dashboard Designer, users can preview their dashboard. Users can change the view mode such as fit to screen, width, or height and even view the dashboard as a slideshow.
The dashboard can be refreshed from the preview and can be exported as a PNG image or PPT.
To see more of the Dashboard Designer’s functionalities in action, check out the Create a BI Dashboard in 5 Minutes video.
Understand the Story Behind Your Data
Need help making sense of your data? Wyn is a web-based BI and data analytics platform that provides greater insight into your data.
Wyn offers built-in tools for report and dashboard creation, data governance, security integration, embedded BI, automated document distribution, and a business-user friendly interface for self-service business intelligence.


Laurie Smith
Laurie A. Smith is the Product Marketing Manager for Wyn Enterprise. She managed content development at the Developer Tools Division before moving to the Wyn Enterprise Business Intelligence Team. Laurie holds an MFA in Film and Digital Media Production from Chatham University, an MBA & a Master’s Degree in Journalism and Mass Communications from Point Park University in Pittsburgh, PA.
In addition to working in technology, she also loves beekeeping, the horror movie genre, and carefully cultivating sunflowers.
Find her on LinkedIn.
Don’t take our word for it.
See what our customers have to say.


Loved by industry
experts and real users
Whether it’s your business or your commercial SaaS app, embed Wyn and empower users to design, share, and distribute interactive dashboards and reports.


