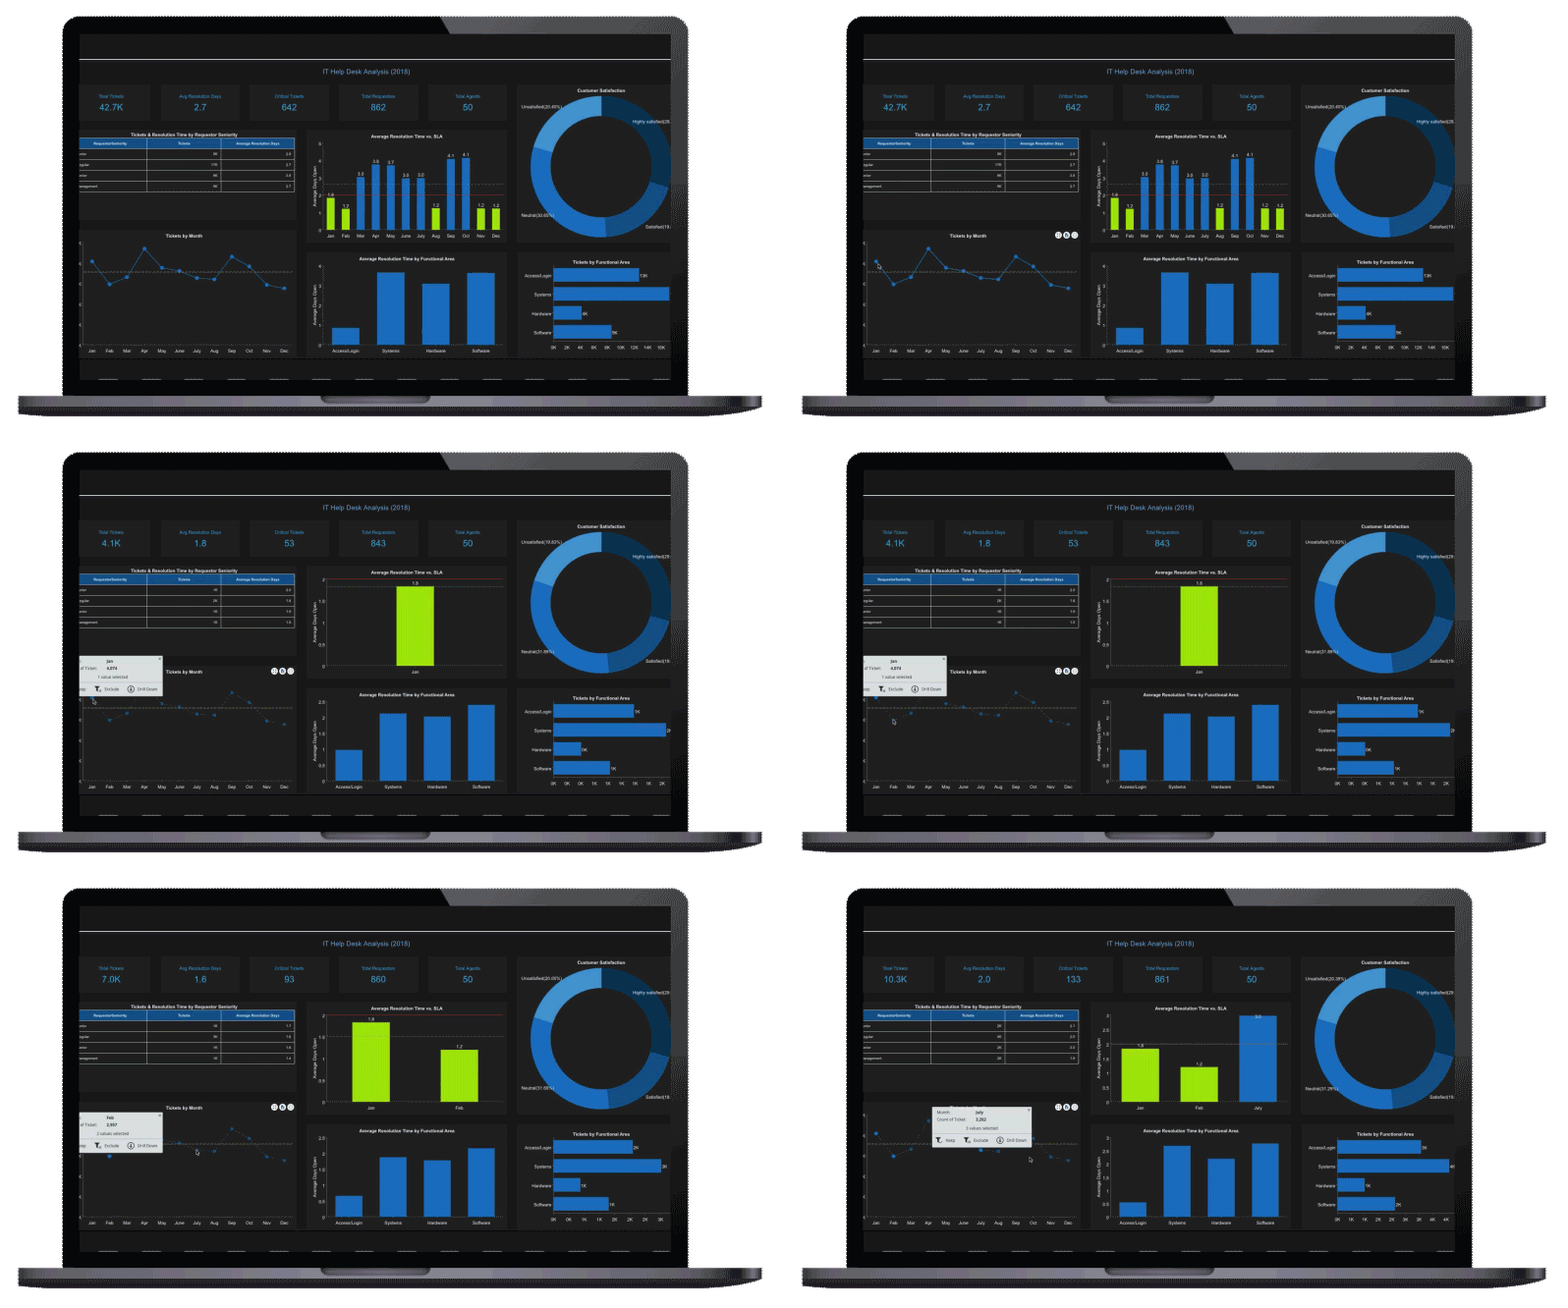
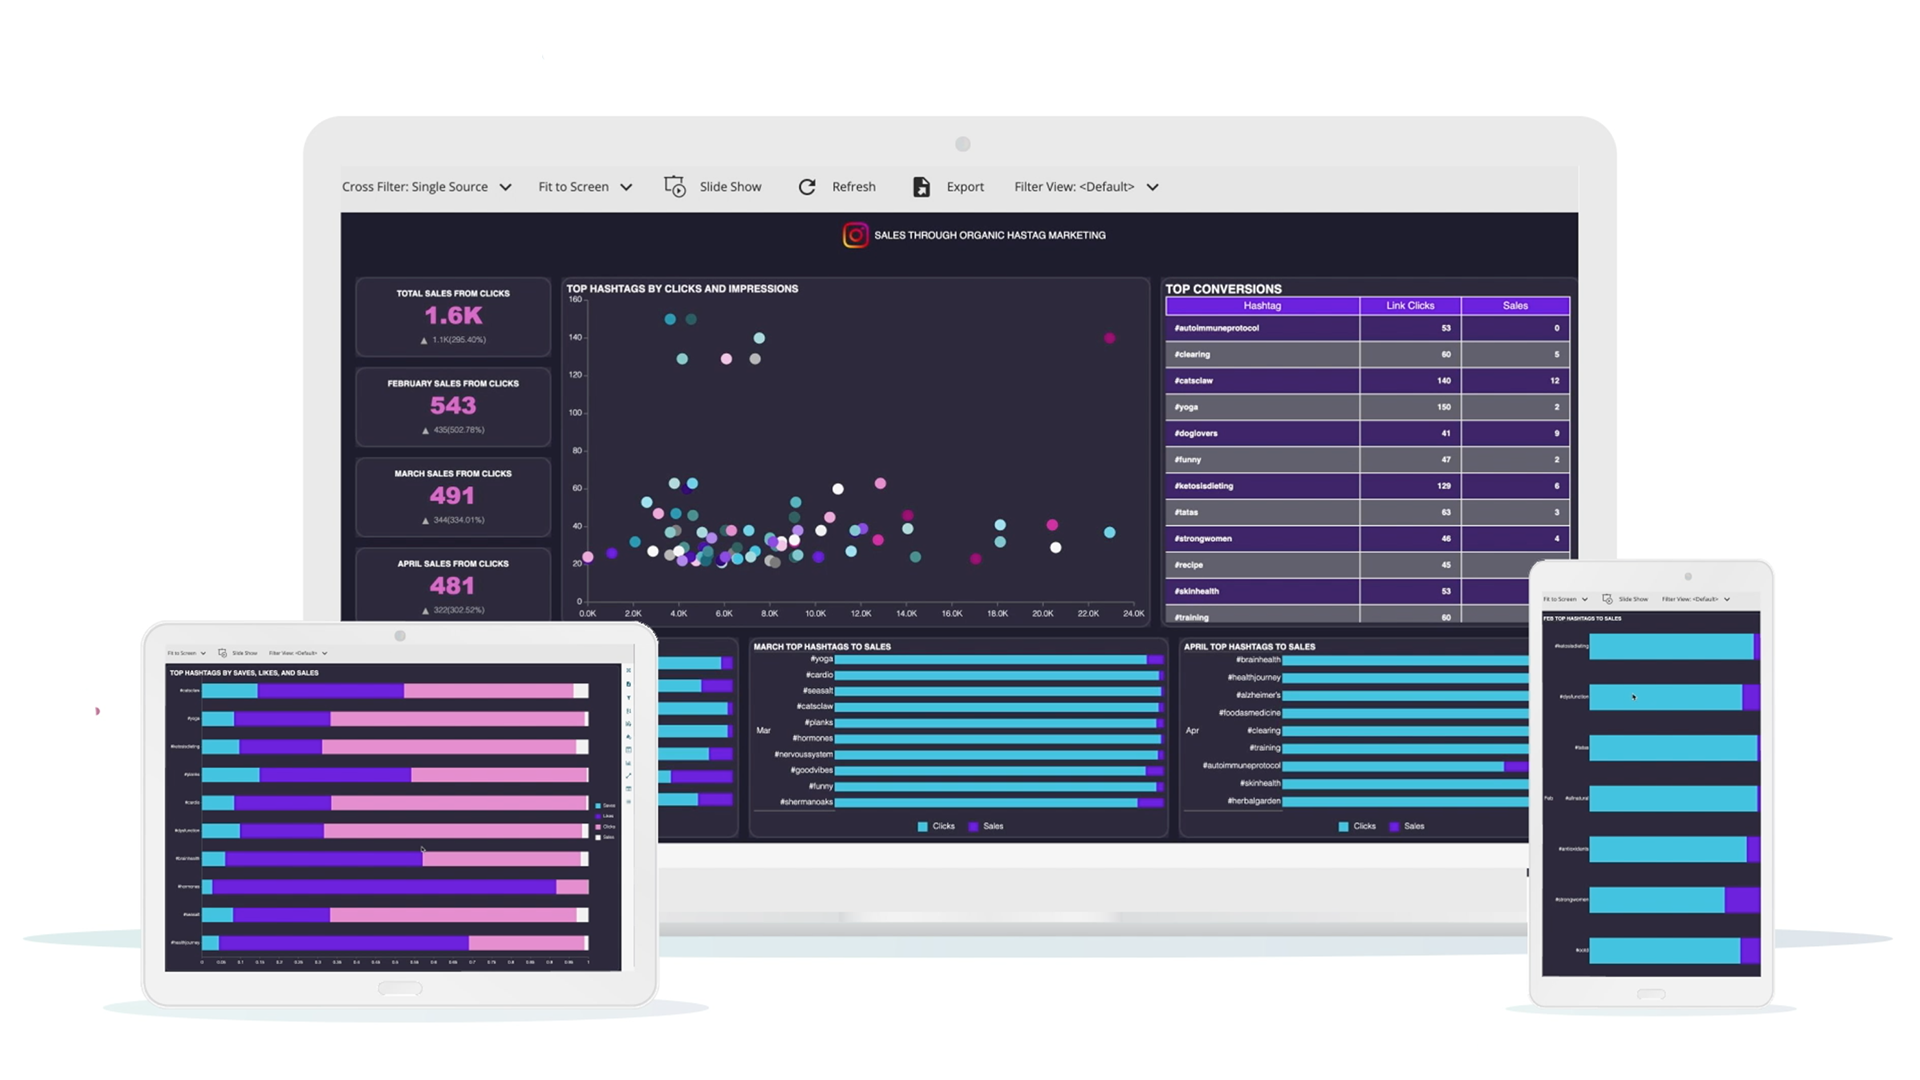
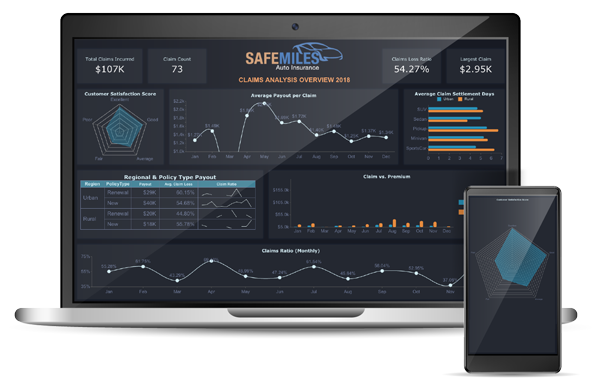
- Interactive dashboards provide intuitive data presentation, allowing users to understand the story behind their data.
- Dashboards visualize all aspects of your business providing actionable insights.
- You can drill into detail and zero in on KPI data points.
- Dashboards offer an up-to-date view of how the organization is performing.
- Identify problems and opportunities to discover what is driving the data.
- Modern BI dashboards are interactive and allow customization with ad-hoc visualizations and trend identifications.

Visualize Your Data. Unlock Your Story.
Your data has a story to tell. When you're able to see the whole story, it all makes sense.
Wyn Enterprise is a business intelligence tool that empowers your users with self-service BI to quickly find important insights within your data and make impactful business decisions. Wyn also helps to save you money with a simple and scalable licensing model.
Wyn Enterprise is Built for Embedded BI
What is Your Data Trying to Tell You?
Data is a business' most valuable resource.
With Wyn Enterprise, you can go from data to insights in minutes.
Watch this 3-minute video to see how Wyn makes this possible!
Embedded BI to Grow With Your Business
A unique licensing model allows Wyn Enterprise to have the lowest total cost of ownership for an embeddable business intelligence tool.
Simple and Scalable Licensing
You need a scalable business intelligence tool. You also need to know how much it will cost in the long run.
Wyn's server-based licensing allows room for business growth without an increase in user fees.
Server-based licensing allows you to scale your business and the user base — with no additional cost.


No per-user fees

No Data Limitations

Fast & High ROI
Embedded BI for Your Business or Commercial SaaS App
Whether it’s your business or your commercial SaaS app, embed Wyn and empower users to design, share, and distribute interactive dashboards and reports.
BI for Your Organization
Empower all end-users to become data-driven. Build a variety of KPIs and dynamic report metrics, all from an embedded business intelligence environment.
BI for Software Vendors
Embed BI, advanced analytics, and distributed reporting into any multi-tenant SaaS application with no per-user fees or data limitations.
Self-Service Dashboards & Reports in One Unified Platform
Self-service BI empowers every end-user the ability to design, share, and distribute interactive dashboards and reports.
Self-service Business Intelligence
Enable users to analyze data without leaving the application they use every day.
- Self-service BI provides insights for everyone.
- Saves time, reduces bottlenecks and saves IT resources
- Improves data literacy and increases team collaboration
- Create a data-driven culture enabling everyone to be independently data-driven

Interactive BI Dashboards
Reveal trends and tell the story behind your data with an expansive collection of data visualization components.
- Analyze data with interactive dashboards
- Deliver actionable information for impactful business decisions
- Slice and dice business information
- Enable Wyn Alerts for data monitoring and notifications
- Create ad hoc visualizations with drill-down and cross-filter functionality
- Summarize and derive insights faster with InsightIQ

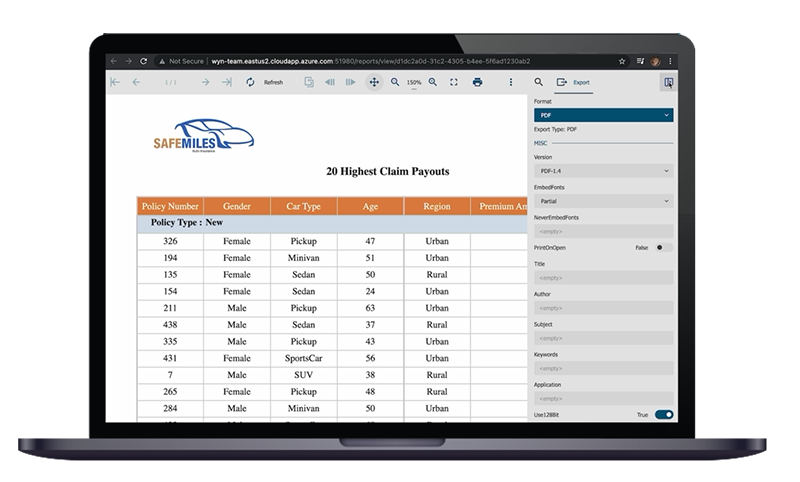
End-User BI Reports
Streamline your operational and transactional reporting processes across your organization.
- User-friendly designer UI to easily prepare reports
- Create reports from your own branded customized templates
- Develop complex interactive reports

What's New at Wyn Enterprise
Explore our latest product features and updates.
Wyn Enterprise v7.1 is Here
Check out all of the newest features and updates in the Wyn Enterprise Server v7.1 release.
NEW! InsightIQ
Learn about all the new features in WynDashboards v7.1 including InsightIQ, which will transform the way you interact with data.
Embedding & Customizing Support
See what's new in WynReports v7.1 including performance optimizations, enriched report types, new parameter controls, and more.
Unleashing Efficiency
Discover how Wyn helped an insurance company transform their legacy reporting system while saving them over half a million dollars.
See What our Customers are Saying:
Frequently Asked Questions
What are the advantages of using BI dashboards?
How can I reduce BI platform costs?
You can lower your total cost of ownership (TCO) with Wyn Enterprise because Wyn is licensed on a per-server basis. This means that there no per-user fees and no run-time royalties. You can scale and add users without worrying about an increase in licensing fees. From a Wyn-licensed server, you can launch an unlimited number of applications to an unlimited number of end-users for a FLAT FEE.
Are Wyn's BI dashboard designers easy to use?
Yes. Wyn's dashboard and report designers are highly intuitive, utilizing simple drag-and-drop interactivity. The Wyn platform is highly customizable, so system admins can hide complex controls from less-technical business users while allowing access to all the "bells and whistles" to their power users. The ability to hide complex functionality from less-technical end-users helps lower an organization's learning curve.
Can I embed Wyn Enterprise modules in my commercial application?
Yes. Wyn's dashboard and report designers are highly intuitive, utilizing simple drag-and-drop interactivity. The Wyn platform is highly customizable, so system admins can hide complex controls from less-technical business users while allowing access to all the "bells and whistles" to their power users. The ability to hide complex functionality from less-technical end-users helps lower an organization's learning curve.


