-
Interactive DashboardsCreate interactive BI dashboards with dynamic visuals.
-
End-User BI ReportsCreate and deploy enterprise BI reports for use in any vertical.
-
Spreadsheet AnalyticsNewLast-Mile Analytics Tool.
-
Narrative Data StoriesThe Next Evolution of Data Storytelling
-
Automated Business DocumentsNewDocument Generation for Smarter Workflows
-
Visual Data Pipeline BuilderDesign Complex Data Flows, Simply.
-
Wyn ArchitectureA lightweight server offers flexible deployment.
-
 Wyn Enterprise 7.1 is ReleasedThis release emphasizes Wyn document embedding and enhanced analytical express...
 -
 Choosing an Embedded BI Solution for SaaS ProvidersAdding BI features to your applications will improve your products, better serve your customers, and more. But where to start? In this guide, we discuss the many options.
-
Visual GalleryInteractive sample dashboards and reports.
-
BlogExplore Wyn, BI trends, and more.
-
WebinarsDiscover live and on-demand webinars.
-
Customer SuccessVisualize operational efficiency and streamline manufacturing processes.
-
Knowledge BaseGet quick answers with articles and guides.
-
VideosVideo tutorials, trends and best practices.
-
WhitepapersDetailed reports on the latest trends in BI.
-
 Choosing an Embedded BI Solution for SaaS ProvidersAdding BI features to your applications will impr...
 -

The bearing seized at 5:17 on the second shift and took the line down with it. The Plant Manager first heard about the stoppage at the 8:30 meeting the next morning. By then, a new part was in place and the line running, but an entire shift’s output was lost.
Manufacturing dashboard improve the response time to problems like these. By enhancing visibility into minute-by-minute operations they give management vital information while there’s time to coordinate a response. Companies implementing business intelligence for manufacturing gain a powerful advantage by ensuring these insights reach managers in real time.
A manufacturing operations dashboard is a key component of a business intelligence system. Think of it as the sharp end, where data is turned into actionable information. It’s often said that knowledge is power: business intelligence systems gather that knowledge and manufacturing dashboards give those (that need it) the power to react. Leading enterprise bi solutions make this process faster and more reliable.
Data, Data Everywhere
Whatever type of manufacturing operation you look at — batch, continuous, process — they have two things in common: they are complicated and they are dynamic. Everything is measured, but despite investing fortunes in ERP and MES, most factory floors actually run on whiteboards and spreadsheets.
Ultimately, there is no easy way for the Plant Manager to know, minute-to-minute and hour-by-hour, how any particular line is performing. Instead, he or she gets a surprise at the morning production meeting, when it’s too late to take corrective action.
As everyone knows, measurement comes before improvement. That’s why many factories are awash with metrics. Yields, scrap, schedule attainment, and availability are just a few of the many measures. In an attempt at simplification, some factories whittle this down to a single KPI, often OEE. (This is despite there being a debate over the value of OEE as a KPI.)
Data for these measures comes from diverse sources. MES provides some; others depend on factory workers maintaining live counts and entering updates into databases and spreadsheets. It works, after a fashion, but there are many problems. These include:
- Data collection errors
- Calculation errors
- Delays/lack of timeliness
- Inconsistent data sources, in a plant with many lines it’s easy to miss some
- Poor distribution of results — they could be late or slow to come out, and key people are sometimes left off
- Time expended on data collection and cleansing
What Manufacturing Plant Managers Want to Know
The Plant Manager is the Captain of an ocean-going freighter. He or she wants to know if the ship is deviating from its intended course so corrections can be applied in a timely matter.
Widely used KPIs include:
- Delivery performance
- Manufacturing lead time (sometimes called ‘total cycle time’ — how long it takes an order to progress through the factory)
- OEE (valued because it pulls together data on production rates, quality, and machine availability)
The Role of the BI Dashboard
Many of these take so long to reach the Plant Manager’s desk that it’s often too late to make changes. When corrective action is taken there’s yet another delay before the result becomes apparent.
The result is that resources are used sub-optimally. Excess costs are incurred, and opportunities are missed. Yet with more visibility, changes could be made quickly. Workers from an idled line could be redeployed to a bottleneck operation. A raw materials shortage could be an opportunity to bring forward some planned maintenance. A sharp decline in yields may indicate that a process is experiencing problems before they become catastrophic.
A better approach is for decision-makers to receive a constant stream of factory information. The best approach is to enhance this information with the ability to forecast and even evaluate the consequences of alternative choices. This is the role of the BI dashboard.
View manufacturing BI dashboard examples →
What is the Manufacturing Operations Dashboard?
A business intelligence dashboard displays the information needed to exercise control. The word originated with automobiles, but today it’s used more widely to describe the graphical presentation of information from diverse sources in a single place. In the case of manufacturing dashboards, that single place is a tablet, though it could also be a laptop or desktop computer.
A key element is that data is presented in a manner that’s easy to visualize. That means graphically. Managers are skilled at discerning trends and patterns in tables and spreadsheets, but graphs and charts make it easier and ensure nothing gets missed.
Manufacturing dashboards are usually customized for individual users. The underlying data is available to all users of the business intelligence system, but each manager or decision-maker selects what they want to see by default. Thus, there’s often a manufacturing inventory dashboard, a manufacturing operations dashboard and so on.
These dashboards are powered by the business intelligence system. This aggregates data from ERP, MES, and other systems and processes it to provide KPIs such as order intake, warranty costs, delivery schedule attainment, and (of course) cash flow. These are then presented in a format that answers the question, “How are we doing today?”
Manufacturing BI Dashboards Offer Better Visibility
Of course, the real value in a manufacturing dashboard is not the attractive data visualizations or even the time saved in their production, but the insights it provides into what’s happening out in the factory. It’s these insights that bring about improvements.
Insights flow from visibility, and that’s what manufacturing dashboards enable: visibility into operations.
Here are 7 ways manufacturing dashboards increase visibility into operations:
- Visualization: Trends stand out when presented graphically. Pareto charts highlight the leading causes of waste or downtime. Pie charts show how capacity is being used.
- Single-source: Unlike with manual data collection, whiteboards, or spreadsheets, the dashboard gets its information from the same place every time — a single source of truth.
- Distributable: Dashboard information can be shared with those who need to know — direct reports, senior managers, or anyone else.
- Timely: Speed of data collection, aggregation, and presentation is a hallmark of business intelligence systems and dashboards. A manufacturing inventory dashboard, for example, can highlight the consumption rate of key raw material, providing time to expedite the next delivery before depletion.
- Granular: Traditional production reports are summaries. With a manufacturing operations dashboard, it’s possible to drill down into the data. Shift output may have been below plan, but with the dashboard, managers can see which line, and even which machine caused the problem, and for how long.
- Accurate: Data entry errors are commonplace. Bias, deliberate or unconscious, is another source of inaccuracy. Business intelligence systems serve up accurate data to the dashboards.
- Consistent: Business intelligence systems collect data systematically. There’s no waiting for reports, collating data or emailing around for numbers. Automation ensures a standardized process, which enables accurate comparisons and benchmarking.
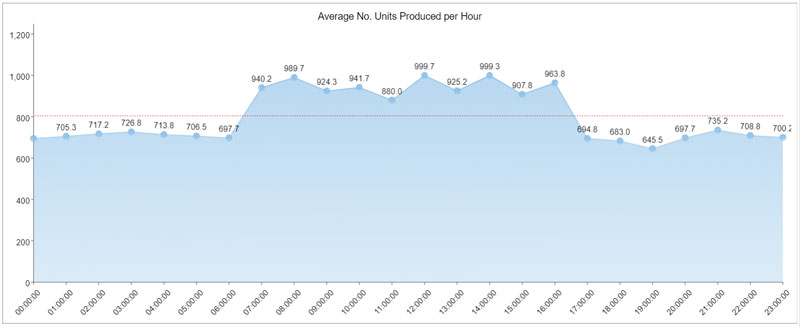
Average Units Per Hour – Wyn Enterprise
Forecasting and Analytics
Manufacturing managers have long wanted the ability to evaluate alternative scenarios. Can we increase output by switching Product A to Line 4, freeing up capacity on the more automated Line 9?
A manufacturing analytics dashboard can provide such a capability. Harnessing the forecasting power of the business intelligence system, this yields insights hitherto impossible to obtain. An analytics dashboard replaces “gut feel” and “seat-of-the-pants” decision-making with scientific analysis. This is moving from improved control to decision support.
The Dashboard Development Process
Implementing or deploying dashboards is primarily an exercise in education and training. This is because, subject to the limitations of the business intelligence system, manufacturing dashboards are customizable and user-driven. In other words, it’s up to each user what they see on their device.
Users typically need education and training to understand what their dashboard can do for them. As they gain familiarity and they start seeing the value they will have requests for more information and capabilities.
In some organizations it may be appropriate to pre-configure the dashboard, perhaps to protect commercially sensitive information.
Consideration should also be given to security. Vendors of business intelligence systems and dashboards will be able to explain how their system guards against unauthorized access or data manipulation.
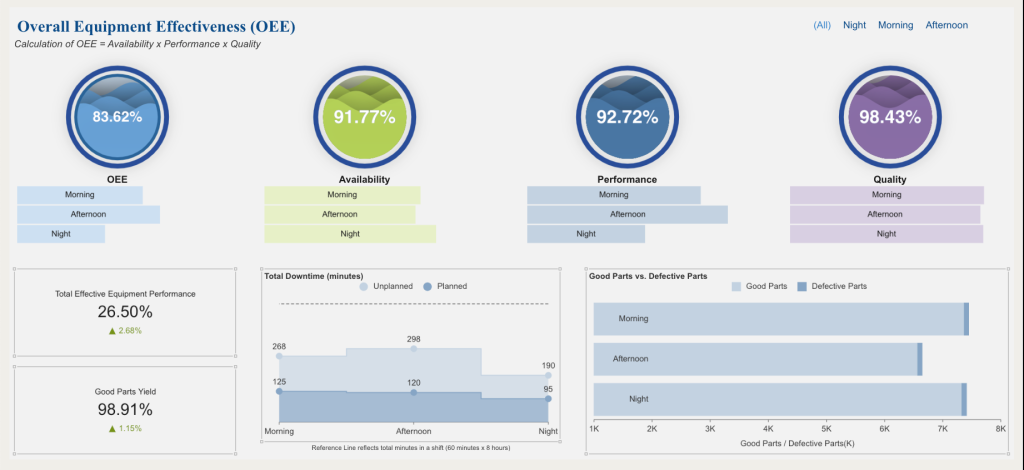
A Manufacturing Dashboard Using Custom Visualizations – Overall Equipment Effectiveness (OEE) Dashboard – Wyn Enterprise
Better Visibility Improves Performance
Manufacturing operations are highly dynamic. Maximizing resource utilization, output and target attainment demands that Managers know what’s happening, everywhere, all the time.
The old systems can’t do this. They’re too slow, and often too ad-hoc, to deliver the visibility needed. It takes too long to recognize a problem, and then a bigger course correction is needed. Like a ship zig-zagging across the ocean, it’s wasteful and inefficient.
The solution is to deploy a business intelligence system that aggregates factory data and dashboards that turn it into actionable information. Then, the next time an unplanned shutdown stops production, management can react immediately. Better resource utilization, less waste, more output, and improved profitability, thanks to the superior visibility afforded by manufacturing dashboards.
FAQ: Manufacturing BI Dashboards
1. What is a manufacturing BI dashboard?
A manufacturing BI dashboard is an interactive data visualization tool that consolidates key performance indicators (KPIs), production data, and operational metrics for manufacturers. It provides real-time insights into production efficiency, quality, costs, and more to support better decision-making.
2. Which KPIs should manufacturers track on their BI dashboards?
Manufacturers rely on BI dashboards to monitor production efficiency and spot areas for improvement. By tracking the right KPIs, they can reduce waste, optimize output, and improve delivery times. These metrics provide visibility into both equipment performance and overall operational health, ensuring manufacturing teams stay aligned with business goals.
Essential KPIs for manufacturing BI dashboards include:
- Overall Equipment Effectiveness (OEE): Measure asset utilization, performance, and quality.
- Yield rates: Track the percentage of products manufactured correctly the first time.
- Downtime: Monitor machine or line stoppages that affect productivity.
- Throughput: Assess the volume of goods produced in a given period.
- Scrap rates: Identify waste and quality issues in the production process.
- Lead times: Measure the time taken from order to delivery.
- Inventory levels: Ensure raw materials and finished goods are managed effectively.
3. How do BI dashboards improve production efficiency?
BI dashboards provide real-time monitoring of equipment performance, output, and bottlenecks. This visibility enables managers to respond quickly to issues, reduce downtime, and streamline manufacturing processes.
4. Can BI dashboards help with quality control in manufacturing?
Yes, dashboards track quality metrics such as defect rates, first-pass yield, and customer returns. This enables proactive quality assurance and supports root-cause analysis for continuous improvement.
5. What are the benefits of real-time data in manufacturing BI dashboards?
Real-time data in manufacturing dashboards gives managers instant visibility into operations, enabling them to act quickly and keep production running smoothly. Instead of relying on outdated or batch reports, teams can spot problems as they occur, adjust schedules, and allocate resources more effectively. This improves efficiency, reduces downtime, and strengthens overall decision-making.
Key benefits of real-time data in manufacturing BI dashboards include:
- Immediate issue detection: Identify equipment failures or bottlenecks as they happen.
- Faster response times: Take corrective action quickly to minimize downtime.
- Accurate demand forecasting: Adjust production based on the latest sales and market data.
- Optimal resource allocation: Ensure labor, machines, and materials are used efficiently.
- Reduced waste: Prevent overproduction and unnecessary inventory buildup.
- Improved customer satisfaction: Deliver on time by aligning production with real demand.
6. Can BI dashboards integrate with MES, ERP, and IoT systems?
Modern BI dashboards seamlessly integrate with Manufacturing Execution Systems (MES), Enterprise Resource Planning (ERP), and IoT devices, enabling unified analysis and a holistic view of plant operations.
7. How do dashboards help reduce manufacturing costs?
Dashboards highlight inefficiencies, excess downtime, or waste, enabling targeted process improvements. By tracking cost drivers and production trends, manufacturers can make data-driven decisions to control expenses.
8. Are manufacturing BI dashboards customizable for different roles?
Yes, dashboards can be tailored for executives, plant managers, engineers, or operators, ensuring each user sees the most relevant data and KPIs for their responsibilities.
9. What should you look for in a manufacturing BI dashboard solution?
Look for user-friendly design, real-time updates, customizable widgets, integration capabilities, secure access, and mobile support. Scalability and strong vendor support are also important for long-term success.
10. Why choose Wyn Enterprise for manufacturing dashboards?
Wyn Enterprise offers customizable, embedded BI dashboards designed for manufacturers, providing unlimited user access, real-time analytics, and integration with existing plant systems helping teams to improve productivity and make smarter, data-driven decisions.

Ethan Conner
As a Technical Account Manager w ith the Wyn Enterprise team, Ethan loves the collaborative, team-oriented culture. In his spare time, he enjoys playing guitar and drums, learning new technologies, and reading. You can find him on LinkedIn.


Loved by industry
experts and real users


