-
Interactive DashboardsCreate interactive BI dashboards with dynamic visuals.
-
End-User BI ReportsCreate and deploy enterprise BI reports for use in any vertical.
-
Wyn AlertsSet up always-on threshold notifications and alerts.
-
Localization SupportChange titles, labels, text explanations, and more.
-
Wyn ArchitectureA lightweight server offers flexible deployment.
-
 Wyn Enterprise 7.1 is ReleasedThis release emphasizes Wyn document embedding and enhanced analytical express...
 -
 Choosing an Embedded BI Solution for SaaS ProvidersAdding BI features to your applications will improve your products, better serve your customers, and more. But where to start? In this guide, we discuss the many options.
-
Visual GalleryInteractive sample dashboards and reports.
-
BlogExplore Wyn, BI trends, and more.
-
WebinarsDiscover live and on-demand webinars.
-
Customer SuccessVisualize operational efficiency and streamline manufacturing processes.
-
Knowledge BaseGet quick answers with articles and guides.
-
VideosVideo tutorials, trends and best practices.
-
WhitepapersDetailed reports on the latest trends in BI.
-
 Choosing an Embedded BI Solution for SaaS ProvidersAdding BI features to your applications will impr...
 -

We often see businesses filter unwanted data rows from BI reports. Changing trends in data analysis and inclination for responsive tables elevated the need for dynamic columns among business analysts. Dynamic columns change the number of columns, by eliminating or simply hiding columns at runtime from the table visualization while keeping only the relevant ones in the analysis report.
You can make columns dynamic using expressions or parameters in a Wyn Report. But changing the number of columns at runtime may disturb the report layout.
Wyn Enterprise 5.0 Report Designer adds an “Auto Width” property to the Table columns making them responsive and be able to fit nicely within the designed Table or Page width.
Here, we’ll see how the property can be used for a simple sales report.
Display Product Sales Data Using a Table
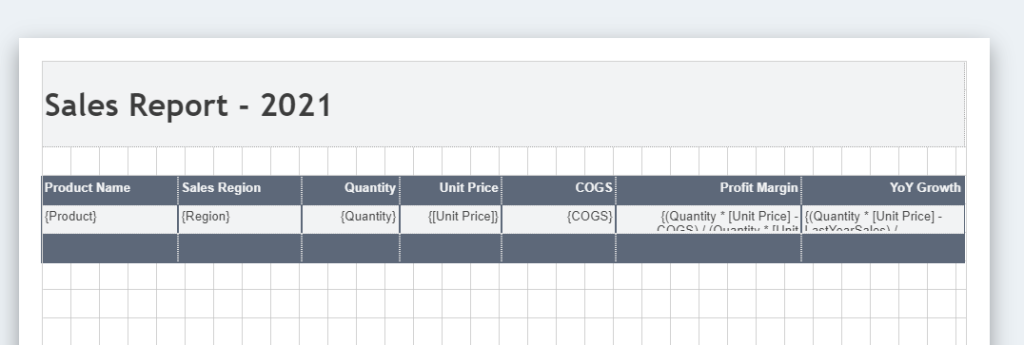
Suppose you need to present product sales data using a Table in the report. The report must show KPIs such as Sales Quantity, Sales Amount, Profit Margin, YoY growth, etc. along with other information such as Product Name, Sales Region, etc.
Each column in the Table is a different KPI having its own calculated measure.
The report may appear in the designer as shown below:
Let’s say the report is intended for multiple users in the organization. And each set of users is interested in one or the other KPI.
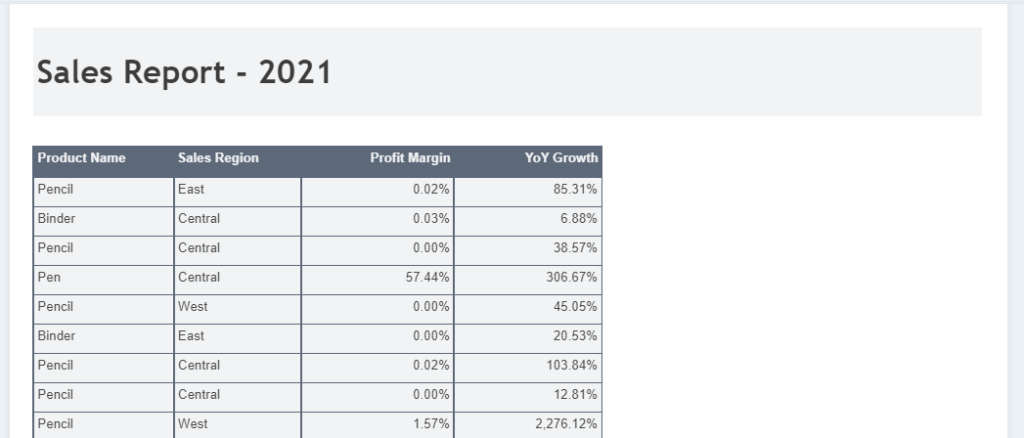
For example, higher management may be interested to see the profit margins and YoY return.
Such a report is expected to appear in preview as shown below:
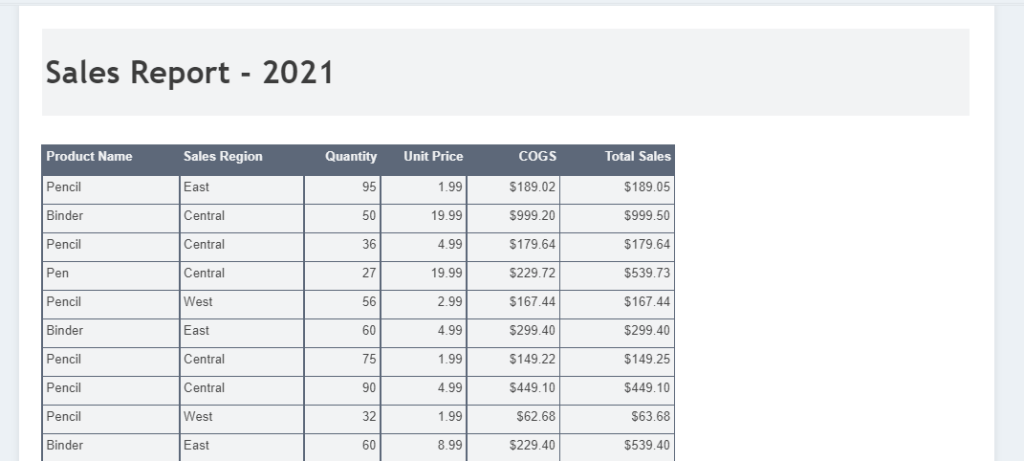
Mid-level managers may be interested to see the actual sales information such as COGS, sales amount, etc.
For them, the report is expected to preview as shown below:
Such dynamism can be achieved using parameters and expressions on the table column’s visibility property. However, you may observe that table width varies for different users due to hidden columns at runtime.
In absence of the new Auto Width property, you may need to create one table for each set of users, select the desired columns, and set width for shown columns. Then use parameters and expressions to determine the visibility of the Table Data region for a particular set of users.
The new Auto width property ensures that a single table fits the page width for a variable number of columns. This property allows the remaining columns to adjust and occupy the empty space left by the hidden columns.
It offers two options:
- None: This is the default value and does not allow columns to grow at runtime.
- Proportional: Select this option to change a column’s width relative to table width and fill the whole table rather than shifting columns to adjust the space left by the hidden column in the table.
You may select all or a few columns to grow and occupy the space and maintain the table width. The choice for the columns depends entirely on your business need. It could be the static columns or the dynamic ones.
To use the property you just need to select the column that you want to grow.
When you select the column, you will find the new “Auto Width” property under the Layout section as shown below:
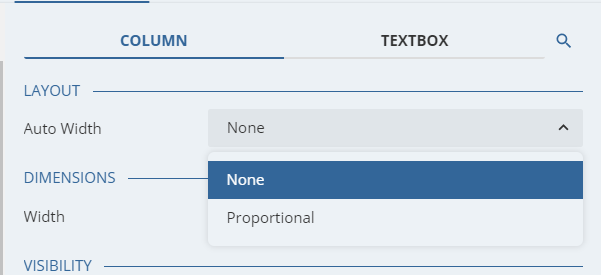
Set the Auto Width property of the selected column to “Proportional” and that’s it.
When you preview such report, table width appears uniform for any number of hidden columns as shown below:
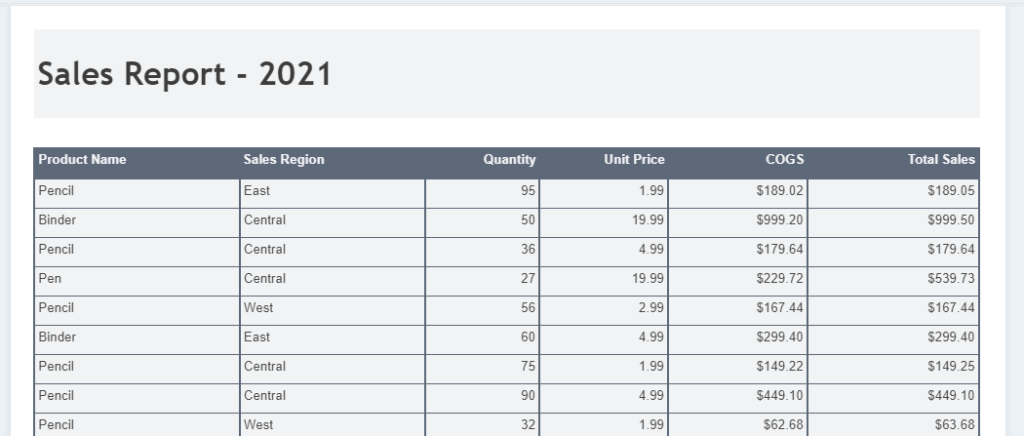
Image showing columns as may be needed by regional managers

Image showing columns as may be needed by higher management.
Better Data Insights = Better Decisions
Let us show you how Wyn Enterprise can provide greater insights into your data.
Learn how to make data insights more attainable, actionable, and valuable. ↓


Paarisha Rana
As a software engineer, Paarisha enjoys the team environment of encouragement and learning. She enjoys reading, aerobics, travelling, and exploring historical places. Paarisha graduated from Uttar Pradesh Technical University (UPTU) at Lucknow (India) with a Bachelor’s of Technology in Information Technology, and you can find her on LinkedIn.


Loved by industry
experts and real users
Whether it’s your business or your commercial SaaS app, embed Wyn and empower users to design, share, and distribute interactive dashboards and reports.


