-
Interactive DashboardsCreate interactive BI dashboards with dynamic visuals.
-
End-User BI ReportsCreate and deploy enterprise BI reports for use in any vertical.
-
Wyn AlertsSet up always-on threshold notifications and alerts.
-
Localization SupportChange titles, labels, text explanations, and more.
-
Wyn ArchitectureA lightweight server offers flexible deployment.
-
 Wyn Enterprise 7.1 is ReleasedThis release emphasizes Wyn document embedding and enhanced analytical express...
 -
 Choosing an Embedded BI Solution for SaaS ProvidersAdding BI features to your applications will improve your products, better serve your customers, and more. But where to start? In this guide, we discuss the many options.
-
Visual GalleryInteractive sample dashboards and reports.
-
BlogExplore Wyn, BI trends, and more.
-
WebinarsDiscover live and on-demand webinars.
-
Customer SuccessVisualize operational efficiency and streamline manufacturing processes.
-
Knowledge BaseGet quick answers with articles and guides.
-
VideosVideo tutorials, trends and best practices.
-
WhitepapersDetailed reports on the latest trends in BI.
-
 Choosing an Embedded BI Solution for SaaS ProvidersAdding BI features to your applications will impr...
 -

Combining data from multiple data sources is one of the most common challenges for business analysts. The disparate data stores are often a collection of integrated or non-integrated data management systems with heterogeneous schemas and query languages.
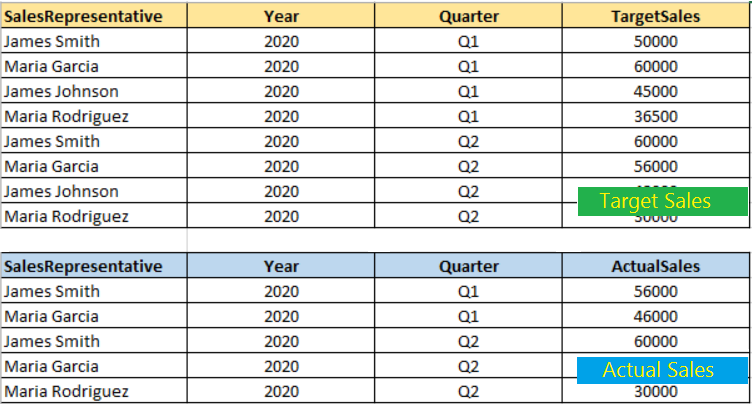
For example, an insurance company stores sales targets and actual sales data in the same system but separate databases, validating sales performance requires mapping between the two datasets. Hospital Management Systems (HIS) and Claims Management Systems (CMS) store patient information and the insurance claims separately. Extracting and visualizing meaningful information from such systems requires merging the datasets.
Combining data using custom SQL queries and Excel is a time-consuming process. New Wyn Multi-Charts allows technical and non-technical users to quickly and easily build visualizations using multiple datasets.
Wyn Enterprise Multi-Source Charts removes all data combining hazels and eliminates the need to do some work outside of the BI tool to be ready with an analytical chart.
Here, we’ll discuss the new and advanced Multi-Source Chart type and the configurations it provides.
Getting Started With Wyn Multi-Source Charts
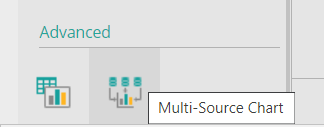
Find the new Multi-Source Charts in the Advanced section of the visualization panel, beside the calc charts icon, in the dashboard designer:
The chart looks similar to other visualizations. When dealing using the Multi-Source Chart, first configure the datasets and generate a single dataset:
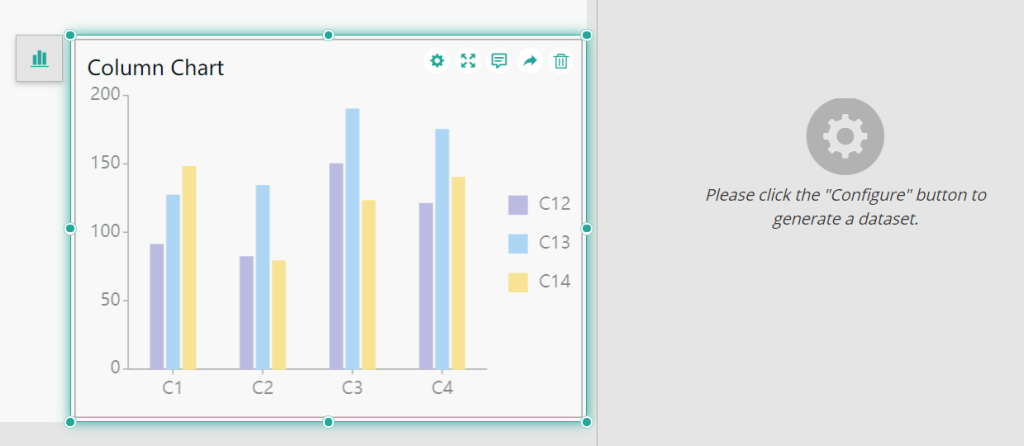
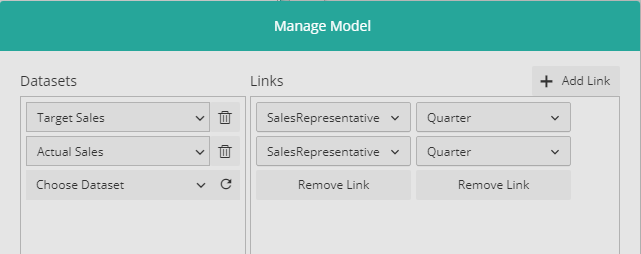
Click the Configure button. This prompts the dialog box shown below. Use it to manage datasets for the chart.
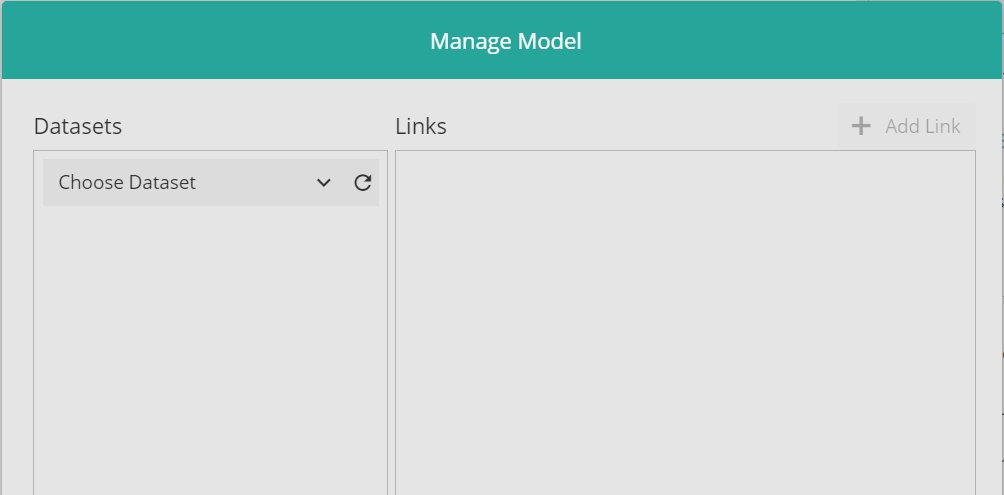
The dialog consists of two sections:
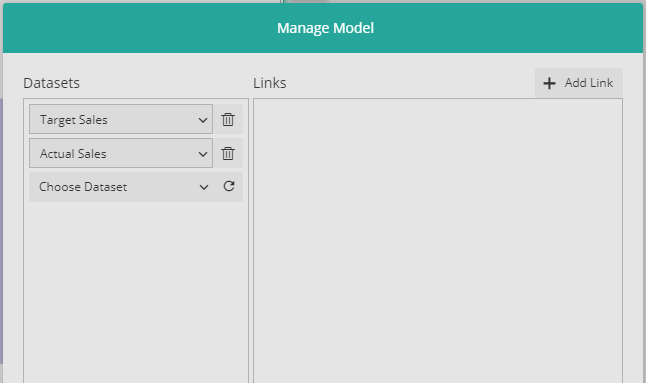
Datasets: in this section, choose two or more Wyn datasets to combine for a visualization.
Links: choose the dimension fields with common data. Combine the dataset selected on the left to fetch merged data for the chart.
For the selected datasets, dimension fields correspond to each dataset as shown below:
Add as many links as required. They are presented horizontally in the dialog:
Multiple links map the data separately and are not joined together.
In the previous example, the links map the data using an SQL query:
Select * from TargetSales
INNER JOIN ActualSales
ON TargetSales.SalesRepresentative = ActualSales.SalesRepresentative
OR
Select * from TargetSales
INNER JOIN ActualSales
ON TargetSales.Quarter = ActualSales.Quarter
rather on both data fields together like in SQL query below:
Select * from TargetSales
INNER JOIN ActualSales
ON
( TargetSales.SalesRepresentative = ActualSales.SalesRepresentative
AND
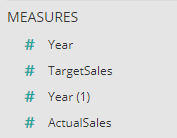
TargetSales.Quarter= ActualSales.Quarter )Once the desired datasets are selected and linked using a dimension, merged dataset fields are listed in the data binding panel. It includes:
All measure fields from the selected datasets, where the duplicated field is identified by a numeric suffix.

Dimension fields used to create the links, where the name of the dimension field comes from the first dataset.
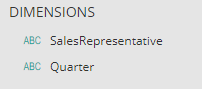
The dataset is now ready for use in the Multi-Source chart like any other conventional chart in the Wyn dashboard.
Measures cannot be used as chart values. The merged datasets are linked using dimensions only.
Multi-source charts support all the properties and settings supported by any standard chart in WynDashboards.
However, there are additional properties and settings unique to multi-source charts.
Multi-Source Charts Specific Configurations and Settings
Dataset Join Type
This property in the Inspector panel lets users choose the type of join (Inner or Full Join) to link the data fields.
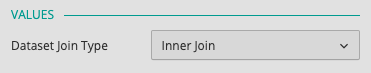
Inner Join fetches selected data for only the matching values from the selected data fields.
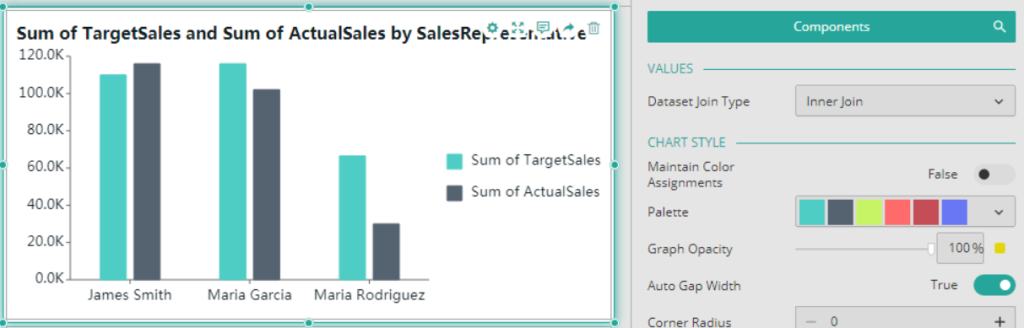
Full Join combines all data from the two datasets. For example, Target vs Actual Sales is shown below:
The Multi-source chart shows data for inner and full join:
Interactivity
Like standard visualization, multi-source charts support various user interactions such as cross-filtering, sorting, and exporting. These actions can be configured on data fetched according to the dataset join type. They are limited to only the dimensions selected for creating the link.
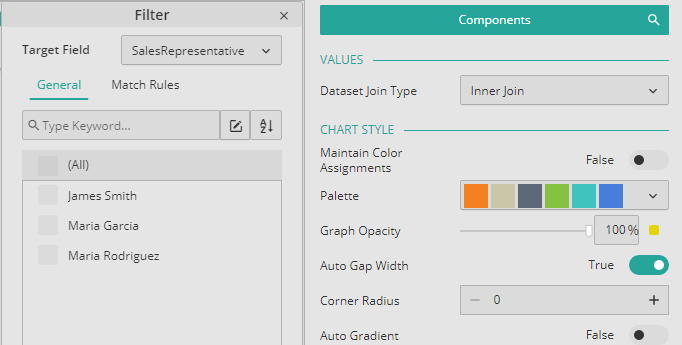
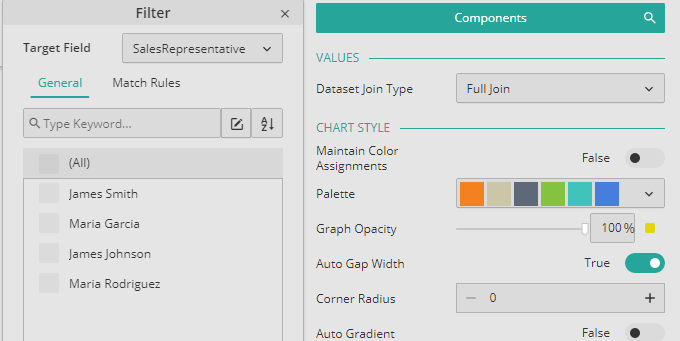
General Filter shows only the selected values when set to inner join type, and shows all data for full join:
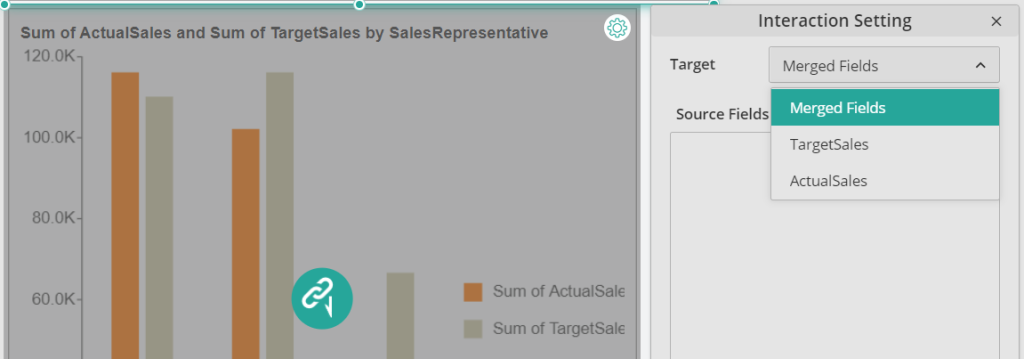
Interaction Setting shows only linked dimension fields in the Source and Target Fields when the multi-source chart is the interaction trigger.
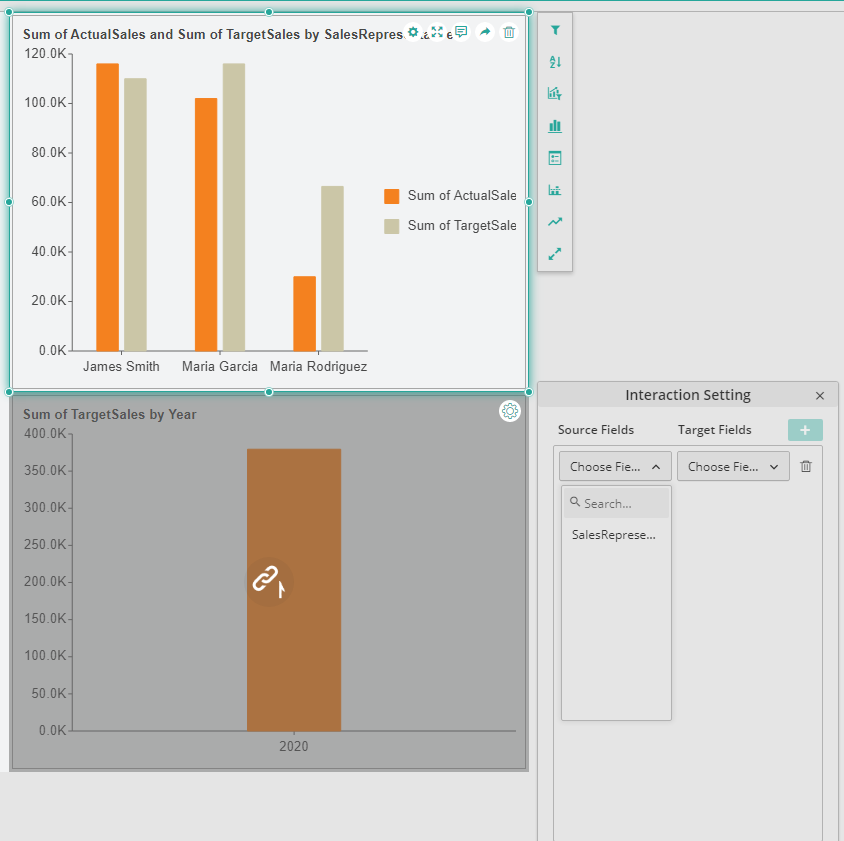
Interaction Receiver for Interaction Setting lets users choose the target fields from the merged dataset and the linked datasets:
Understand the Story Behind Your Data
Wyn is a web-based BI and data analytics platform that provides greater insight into your data.
Wyn offers built-in tools for report and dashboard creation, data governance, security integration, embedded BI, automated document distribution, and a business-user-friendly interface for self-service business intelligence.


Paarisha Rana
As a software engineer, Paarisha enjoys the team environment of encouragement and learning. She enjoys reading, aerobics, travelling, and exploring historical places. Paarisha graduated from Uttar Pradesh Technical University (UPTU) at Lucknow (India) with a Bachelor’s of Technology in Information Technology, and you can find her on LinkedIn.


Loved by industry
experts and real users
Whether it’s your business or your commercial SaaS app, embed Wyn and empower users to design, share, and distribute interactive dashboards and reports.


