-
Interactive DashboardsCreate interactive BI dashboards with dynamic visuals.
-
End-User BI ReportsCreate and deploy enterprise BI reports for use in any vertical.
-
Wyn AlertsSet up always-on threshold notifications and alerts.
-
Localization SupportChange titles, labels, text explanations, and more.
-
Wyn ArchitectureA lightweight server offers flexible deployment.
-
 Wyn Enterprise 7.1 is ReleasedThis release emphasizes Wyn document embedding and enhanced analytical express...
 -
 Choosing an Embedded BI Solution for SaaS ProvidersAdding BI features to your applications will improve your products, better serve your customers, and more. But where to start? In this guide, we discuss the many options.
-
Visual GalleryInteractive sample dashboards and reports.
-
BlogExplore Wyn, BI trends, and more.
-
WebinarsDiscover live and on-demand webinars.
-
Customer SuccessVisualize operational efficiency and streamline manufacturing processes.
-
Knowledge BaseGet quick answers with articles and guides.
-
VideosVideo tutorials, trends and best practices.
-
WhitepapersDetailed reports on the latest trends in BI.
-
 Choosing an Embedded BI Solution for SaaS ProvidersAdding BI features to your applications will impr...
 -

With the constantly changing world of data analytics and business intelligence, embedded BI tools need to be fast, robust, and easy to customize.
BI tools understandably take time to load visualizations. BI dashboards have many technical components working in tandem. Sometimes, data analysts and dashboard creators face a common obstacle of slow dashboards, making users wait for charts and animations to load.
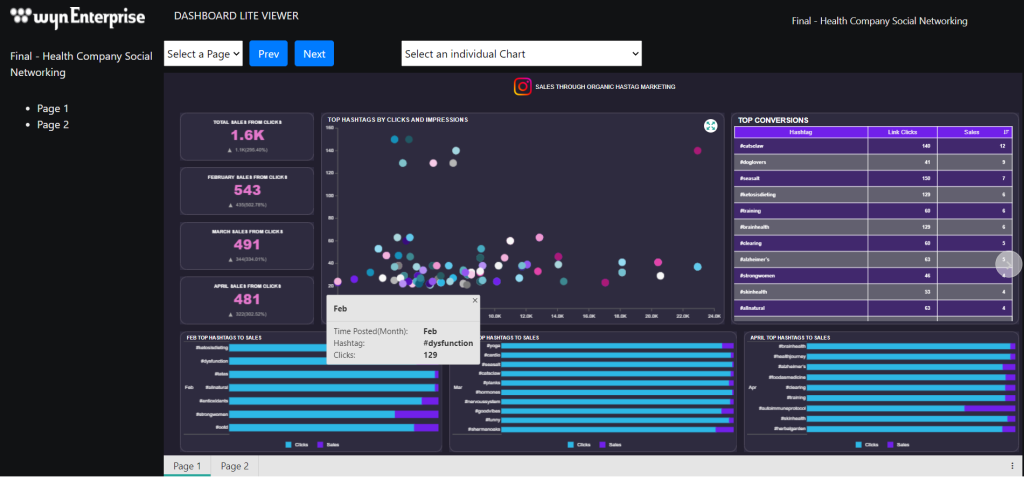
With this in mind, the LiteViewer was developed. The LiteViewer is a new lightweight viewer (owing its name to the small file size ~3.5 MB). The LiteViewer significantly improves dashboard loading speed. The LiteViewer also provides APIs for users to customize the layout and add animations to individual charts.
Here, we’ll show you how to preview your dashboard with the LiteViewer.
Required Resources
LiteViewer requires the following resources:
- polyfills.js // this file is not part of viewer lite. It provides some polyfills on global.
- dashboard.viewerLite.css
- dashboard.viewerLite.vendor.css
- dashboard.viewerLite.js
- dashboard.viewerLite.sheet.js
- dashboard.viewerLite.chart.js
These resources can be referenced locally or through Wyn Dashboards API as below:
LiteViewer References
<script type="text/javascript" src="https://<wynUrl>/lib/polyfills.js"></script>
<script type="text/javascript" src="https://<wynUrl>/api/PluginAssets/dashboards-5.0.19561.0/dashboard.viewerLite.js"></script>
<script type="text/javascript" src="https://<wynUrl>/api/PluginAssets/dashboards-5.0.19561.0/dashboard.viewerLite.chart.js"></script>
<script type="text/javascript" src="https://<wynUrl>/api/PluginAssets/dashboards-5.0.19561.0/dashboard.viewerLite.sheet.js"></script>

<link rel="stylesheet" href="https://<wynUrl>/api/PluginAssets/dashboards-5.0.19561.0/dashboard.viewerLite.css" />
<link rel="stylesheet" href="https://<wynUrl>/api/PluginAssets/dashboards-5.0.19561.0/dashboard.viewerLite.vendor.css" />
Let’s now dive into the specifics of the LiteViewer and its APIs.
LiteViewer API
The LiteViewer’s API is pretty simple and can be set up within no time. An instance of LiteViewer can be created using the WynDashboards.createViewerLite() function.
LiteViewer Instance
const liteViewer = WynDashboards.createViewerLite({
dashboardId: 'xxxxxxxxxxxxxxxx', // Dashboard Guid
token: 'xxxxxxxxxxxxxxxx', // Access token
baseUrl: 'xxxxxxxx', // Wyn Server Url
lng: 'en-us', // Language
dp: '',
theme: 'default' // options: custom theme should work with correct css file
});

// Destroy the instance if needed
liteViewer.destroy();
Integrating Dashboards with LiteViewer
Once the LiteViewer has been created, we can integrate Dashboards using its initialize API. LiteViewer provides three methods to integrate Dashboards in your application:
- Integrate full Dashboard
- Integrate single Page
- Integrate individual Chart/Visualization
The LiteViewer requires two DOM elements – one as a container for the LiteViewer itself and the other to act as a container for the Dashboard.
Div
<main id="root">
  <div id="dashboard-root">
  </div>
</main>
Integrate Full Dashboard
We can integrate an entire Dashboard in LiteViewer using the following method:
How to Integrate Dashboard
const viewerRoot = document.querySelector('#root');

liteViewer.initialize({ container: viewerRoot, }).then((uiDashboard) => {
    const dashboardDom = document.querySelector('#dashboard-root');
    uiDashboard.connect(dashboardDom); // mount the dashboard onto this dom

    // listen to the event if you need
    uiDashboard.on('render', () => {
        console.log('>>>', uiDashboard.name, 'uiDashboard render start');
    });
    uiDashboard.on('rendered', () => {
        console.log('>>>', uiDashboard.name, 'uiDashboard render end');
    });
    uiDashboard.on('mounted', () => {
        console.log('>>>', uiDashboard.name, 'uiDashboard mounted');
    });
    // trigger dashboard render
    uiDashboard.refresh();
});
The ‘connect’ method mounts the Dashboard onto the DOM element (dashboard-root in this case).
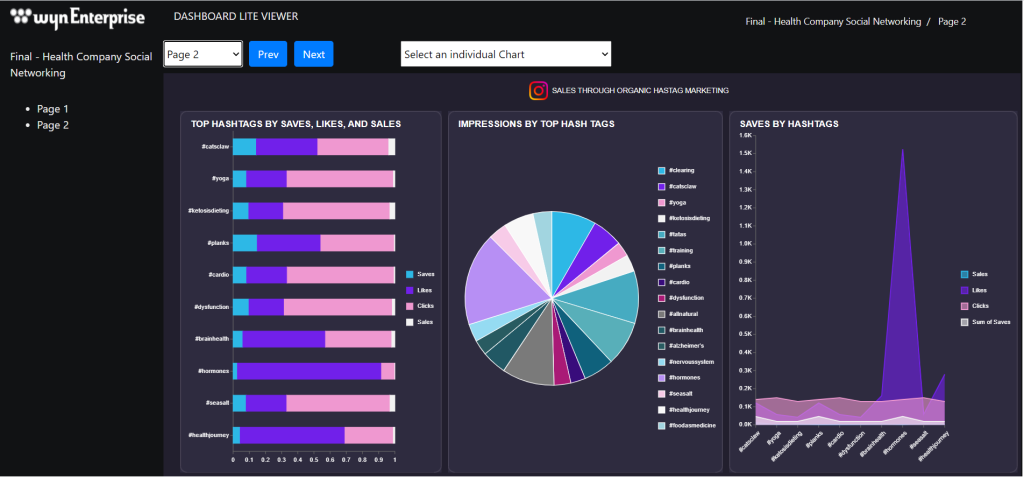
Integrate Single Page
The LiteViewer provides the feature to integrate a single page out of a Dashboard with multiple pages to focus on one topic/area of the Dashboard.
How to Integrate Single Page
const viewerRoot = document.querySelector('#root');

liteViewer.initialize({ container: viewerRoot, }).then((uiDashboard) => {
    const firstPage = uiDashboard.pages[0]; // UIPage
    const pageDom = document.querySelector('#dashboard-root');
    firstPage.connect(pageDom);

    firstPage.on('render', () => {
        console.log('>>>', firstPage.name, 'page render start')
    });
    firstPage.on('rendered', () => {
        console.log('>>>', firstPage.name, 'page render end')
    });
    firstPage.on('mounted', () => {
        console.log('>>>', firstPage.name, 'page mounted')
    });
    firstPage.refresh();
});
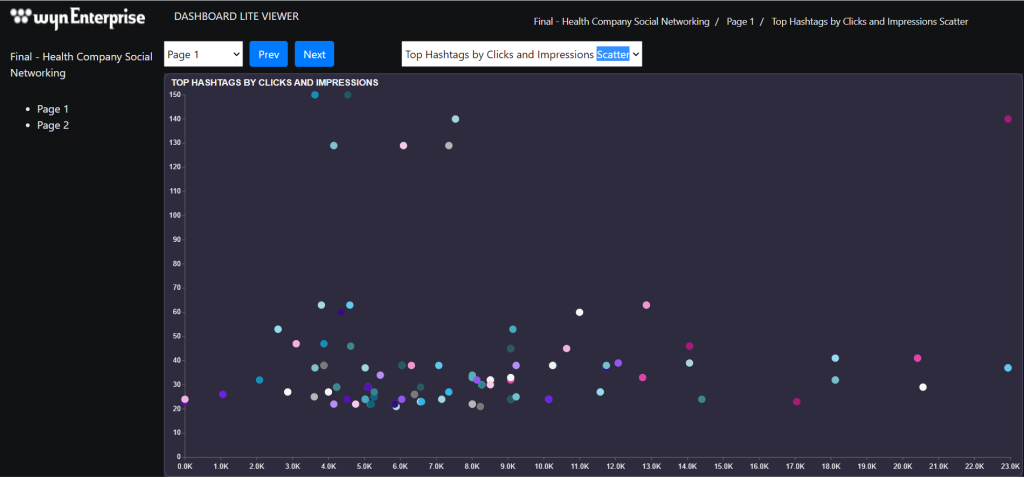
Integrate Individual Chart/Visualization
We can even integrate an individual Chart/Visualization using the LiteViewer with ease to focus on a particular Chart or KPI.
How to Integrate Individual Chart
const viewerRoot = document.querySelector('#root');

liteViewer.initialize({ container: viewerRoot, }).then((uiDashboard) => {
    const firstPage = uiDashboard.pages[0];
    const firstScenario = firstPage.widgets[0]; // UIScenario or UIContainer
    const scenarioDom = document.querySelector('#dashboard-root');
    firstScenario.connect(scenarioDom);

    firstScenario.on('render', () => {
        console.log('>>>', firstScenario.name, ' scenario render start')
    });
    firstScenario.on('rendered', () => {
        console.log('>>>', firstScenario.name, ' scenario render end')
    });
    firstScenario.on('mounted', () => {
        console.log('>>>', firstScenario.name, ' scenario mounted')
    });
    firstScenario.on('update', () => {
        console.log('>>>', firstScenario.name, ' scenario update')
    });
    firstScenario.refresh();
 });
Similarly, we can mount other individual Charts/Visualizations on DOM elements.
Download Sample
Download ASP.NET Core Sample
Embedded BI Dashboards
With embedded business intelligence dashboards, you can analyze data and deliver actionable information with interactive dashboards, multi-dimensional dynamic analysis, and intelligent drilling.
If you are vetting embedded BI solutions, take a look at Wyn Enterprise and our interactive dashboard and BI report gallery.
You can schedule a demo here to speak with a Wyn expert to address your specific BI requirements.
Better Data Insights = Better Decisions
Let us show you how Wyn Enterprise can provide greater insights into your data.
Learn how to make data insights more attainable, actionable, and valuable. ↓


Abdias Michael
A veteran of the technical team, Senior Software Engineer Abdias Michael loves working with new technologies and focusing on providing quality solutions to customers. In his spare time, he enjoys traveling, playing guitar, and badminton. He has a Bachelor of Engineering degree from Dronacharya College of Engineering. You can find him on Twitter at @abdiasm.


Loved by industry
experts and real users
Whether it’s your business or your commercial SaaS app, embed Wyn and empower users to design, share, and distribute interactive dashboards and reports.


