-
Interactive DashboardsCreate interactive BI dashboards with dynamic visuals.
-
End-User BI ReportsCreate and deploy enterprise BI reports for use in any vertical.
-
Wyn AlertsSet up always-on threshold notifications and alerts.
-
Localization SupportChange titles, labels, text explanations, and more.
-
Wyn ArchitectureA lightweight server offers flexible deployment.
-
 Wyn Enterprise 7.1 is ReleasedThis release emphasizes Wyn document embedding and enhanced analytical express...
 -
 Choosing an Embedded BI Solution for SaaS ProvidersAdding BI features to your applications will improve your products, better serve your customers, and more. But where to start? In this guide, we discuss the many options.
-
Visual GalleryInteractive sample dashboards and reports.
-
BlogExplore Wyn, BI trends, and more.
-
WebinarsDiscover live and on-demand webinars.
-
Customer SuccessVisualize operational efficiency and streamline manufacturing processes.
-
Knowledge BaseGet quick answers with articles and guides.
-
VideosVideo tutorials, trends and best practices.
-
WhitepapersDetailed reports on the latest trends in BI.
-
 Choosing an Embedded BI Solution for SaaS ProvidersAdding BI features to your applications will impr...
 -

As a social networking producer for an international supplement company, I was regularly tasked with reporting on campaign metrics pulled from several social platforms. Social media platforms make up 33 percent of all internet usage, so capturing and effectively reporting on social media data can be an enormous task.
I was tasked with connecting Instagram hashtag engagement to sales conversion. I needed to report on Instagram engagement stats alongside regional sales numbers and leads generated.
I was present for the 2016 vegan boom. That year, vegan content became 300% more popular than ever, and we were a vegan company promoting a raw vegan diet. When I started working with them, we had 43k followers. By the time I left, their following count had almost tripled, reaching 108k. The internal content team was the only digital marketing available.
This growth of 65k followers resulted from taking advantage of the fact that people were using Instagram every hour to find ideas on improving their health. Hashtag marketing was a large part of this.
The right hashtag and content combo would get us in view of tens of thousands of new impressions a day.
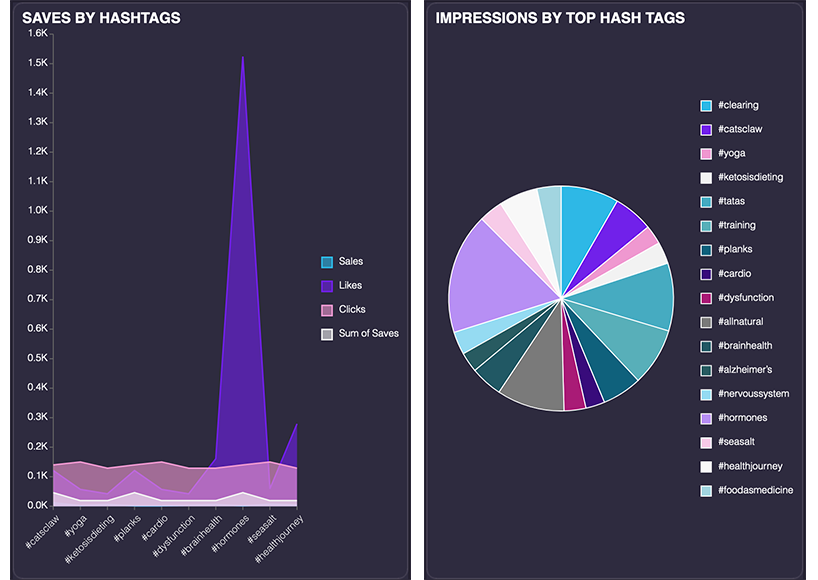
Data Visualizations within Hashtag Marketing
Using social BI, I created an interactive dashboard with several KPIs. I was able to drill-down on each visualization to see how the hashtag performed and how it related to:
- Total sales from clicks per month
- Top hashtag by click and impressions
- Top conversions
View the Dashboard – Understanding Hashtag Analytics
Using a Hashtag Analytics Dashboard – Learned Outcomes
We found taking social networking cues from our followers was the most successful.
By analyzing the data in these dashboards, I was able to apply cues. Having the ability to create the BI dashboard, helped open up my strategy for hashtag marketing moving forward.
I was able to drill-down and visualize hashtag engagement and how each relates to sales conversions over a period of 3 months.
Other Gained Insights:
1. Using the same tags over and over again does not work.
2. Instagram says you can use 30 tags but don’t do that, try using up to 9.
3. Niche tags and tags with followers in the tens of thousands are more successful than tags with millions of followers.
For us, “#catsclaw” was a hit! The other top hashtags leading to sales were “#brainhealth,” “#seasealt,” and “#doglovers.”
Understanding Hashtag Analytics Dashboard – Mobile View
Through the use of embedded BI, I was able to gain the ability to create the BI dashboard and enhance my data exploration efforts.
Incorporating interactive dashboards into my digital marketing methods helped open up my strategy for hashtag marketing moving forward, aided in improving my overall efficiency, and gave me new, meaningful insights into our customer interests
View the Dashboard – Understanding Hashtag Analytics
Better Data Insights = Better Decisions
Let us show you how Wyn Enterprise can provide greater insights into your data.
Learn how to make data insights more attainable, actionable, and valuable. ↓


Loved by industry
experts and real users
Whether it’s your business or your commercial SaaS app, embed Wyn and empower users to design, share, and distribute interactive dashboards and reports.


