-
Interactive DashboardsCreate interactive BI dashboards with dynamic visuals.
-
End-User BI ReportsCreate and deploy enterprise BI reports for use in any vertical.
-
Wyn AlertsSet up always-on threshold notifications and alerts.
-
Localization SupportChange titles, labels, text explanations, and more.
-
Wyn ArchitectureA lightweight server offers flexible deployment.
-
 Wyn Enterprise 7.1 is ReleasedThis release emphasizes Wyn document embedding and enhanced analytical express...
 -
 Choosing an Embedded BI Solution for SaaS ProvidersAdding BI features to your applications will improve your products, better serve your customers, and more. But where to start? In this guide, we discuss the many options.
-
Visual GalleryInteractive sample dashboards and reports.
-
BlogExplore Wyn, BI trends, and more.
-
WebinarsDiscover live and on-demand webinars.
-
Customer SuccessVisualize operational efficiency and streamline manufacturing processes.
-
Knowledge BaseGet quick answers with articles and guides.
-
VideosVideo tutorials, trends and best practices.
-
WhitepapersDetailed reports on the latest trends in BI.
-
 Choosing an Embedded BI Solution for SaaS ProvidersAdding BI features to your applications will impr...
 -

New Release
Wyn Enterprise v5.0 is now available. This release includes report and dashboard improvements, scheduling enhancements, new diagnostic and monitoring tools, and support for new data sources.
Business users are always asking for new data to find trends and insights in their daily business data. Fixed scope datasets do not always address the varied needs of business users. As data continuously grows and becomes more challenging to manage, we have included support for data sources that handle large amounts of data.
We have support for several additional data sources, including:
- ElasticSearch
- Hive DB
- Apache Spark
- HANA
- MongoDB – Native Query
Let’s explore all of the new enhancements in WynDashboards.
Read the full WynReports v5.0 release.
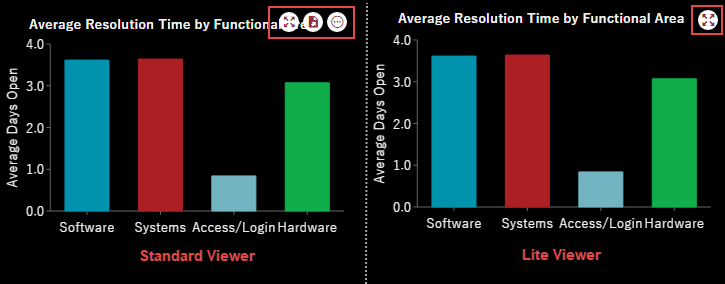
Lightweight Dashboard Viewer
Wyn 5.0 offers a lightweight, fully interactive dashboard viewer for large screen displays and slower networks. The new dashboard viewer is highly embeddable with more dashboard control.
Share KPIs and actionable insights on the large screen display; ideal for manufacturing floors, IT helpdesks, anywhere you need to see real-time data and daily progress with a large, open display.
New Dashboard Exports
Export to PDF for Dashboards
Using scheduled tasks, you can export and distribute PDfs via email attachments. You can manually schedule, as a one-time task, or on a regular schedule.
Learn more about task scheduling.
Support for Data Models and DirectQuery for Dashboard Visuals
Wyn 5.0 offers Analytics Models to structure data in a user-friendly relational structure from DB. This is similar to Reports Semantic Models. Using Analytics Models, data visualizations query the database directly (DirectQuery) to get the latest data for visualization and analytics.
Learn more about new data models for dashboards.
Embedded BI Enhancements for Dashboards
This release offers new settings to further customize dashboard elements.
Enhancements include:
- Host Custom Visuals in DIV elements
- Customize the user interactivity on the Dashboard Viewer
- The ability to control Dashboard Viewer behavior with JS Events
Read more about these enhancements in our documentation.
Data Visualization Enhancements
Improved data visualization elements include new column charts, bar charts, and enhanced Calc charts.
Column charts are used to compare categorical data through vertical bars with categories plotted on the x-axis and data values along the vertical axis. Column chart applications find where the number of values is too large to be used on an x-axis. For example, the population share of different countries across the globe can be represented using a column chart.
Wyn Enterprise supports column charts as well as the variations Range Column Chart, Stacked Column Chart, and Percent Stacked Column Chart.
Learn how to create column charts and bar charts in Wyn Enterprise.

Calc charts enable users to calculate and visualize custom metrics in a dashboard dynamically. With Calc Charts, users can easily organize, gather, maintain, and visualize the data that is normally unavailable in the dataset.
Learn more about Calc charts.

Other Enhancements Include:
- Data labels for aggregate groups/categories in charts
- Use a data table to visualize the output of Calc Charts
- Export data table rows into one Excel sheet
Dashboard Design-Time Enhancements
Wyn’s design-time enhancements include several new customization and white-labeling options.
Wyn Enterprise has always offered a variety of built-in fonts for use in dashboards. With v5.0, we offer support for the inclusion of custom fonts!
- Customize the interactivity behavior for data visualizations
- Set defaults for Parameters based on UserContext values
- Embedding Documents in Dashboards as Scenarios
- Grouping of Scenarios at Design Time
Filtering and Slicing Enhancements
Users have additional options for custom sorting in slicers and enhanced conditional formatting. This release offers support for hierarchical selection (as well as single value selection in TreeView Slice). Filtering data improvements allow users to choose the “And/Or” in filter criteria.
With Wyn Enterprise v5.0
Understand the Story Behind Your Data
Wyn’s continued enhancements make data analysis faster and more flexible, enabling every end-user to transform raw data into actionable insights.


Laurie Smith
Laurie A. Smith is the Product Marketing Manager for Wyn Enterprise. She managed content development at the Developer Tools Division before moving to the Wyn Enterprise Business Intelligence Team. Laurie holds an MFA in Film and Digital Media Production from Chatham University, an MBA & a Master’s Degree in Journalism and Mass Communications from Point Park University in Pittsburgh, PA.
In addition to working in technology, she also loves beekeeping, the horror movie genre, and carefully cultivating sunflowers.
Find her on LinkedIn.


Loved by industry
experts and real users
Whether it’s your business or your commercial SaaS app, embed Wyn and empower users to design, share, and distribute interactive dashboards and reports.


