-
Interactive DashboardsCreate interactive BI dashboards with dynamic visuals.
-
End-User BI ReportsCreate and deploy enterprise BI reports for use in any vertical.
-
Spreadsheet AnalyticsNewLast-Mile Analytics Tool.
-
Narrative Data StoriesThe Next Evolution of Data Storytelling
-
Automated Business DocumentsNewDocument Generation for Smarter Workflows
-
Visual Data Pipeline BuilderDesign Complex Data Flows, Simply.
-
Wyn ArchitectureA lightweight server offers flexible deployment.
-
 Wyn Enterprise 7.1 is ReleasedThis release emphasizes Wyn document embedding and enhanced analytical express...
 -
 Choosing an Embedded BI Solution for SaaS ProvidersAdding BI features to your applications will improve your products, better serve your customers, and more. But where to start? In this guide, we discuss the many options.
-
Visual GalleryInteractive sample dashboards and reports.
-
BlogExplore Wyn, BI trends, and more.
-
WebinarsDiscover live and on-demand webinars.
-
Customer SuccessVisualize operational efficiency and streamline manufacturing processes.
-
Knowledge BaseGet quick answers with articles and guides.
-
VideosVideo tutorials, trends and best practices.
-
WhitepapersDetailed reports on the latest trends in BI.
-
 Choosing an Embedded BI Solution for SaaS ProvidersAdding BI features to your applications will impr...
 -

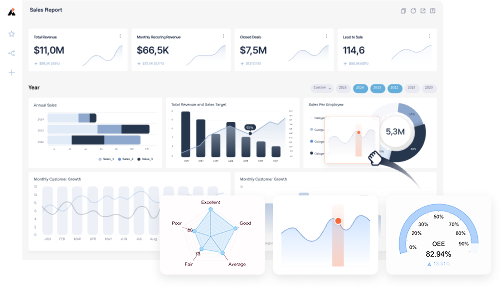
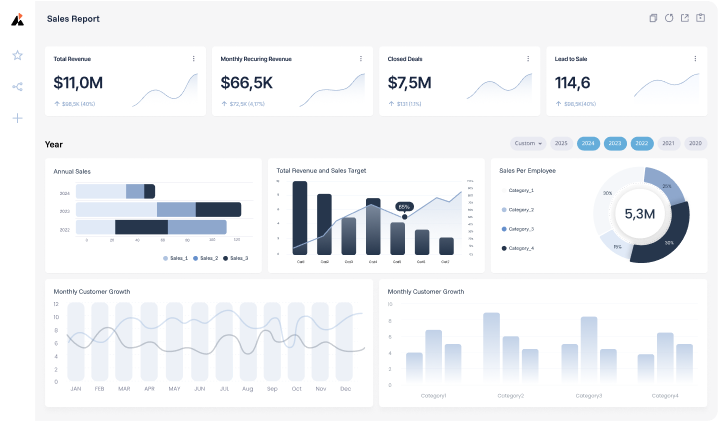
Interactive Business Intelligence (BI) Dashboards
Visualize, analyze, and identify trends with dynamic BI dashboards. Empower your end-users to design interactive business intelligence dashboards to promote analysis and strategic decision-making.

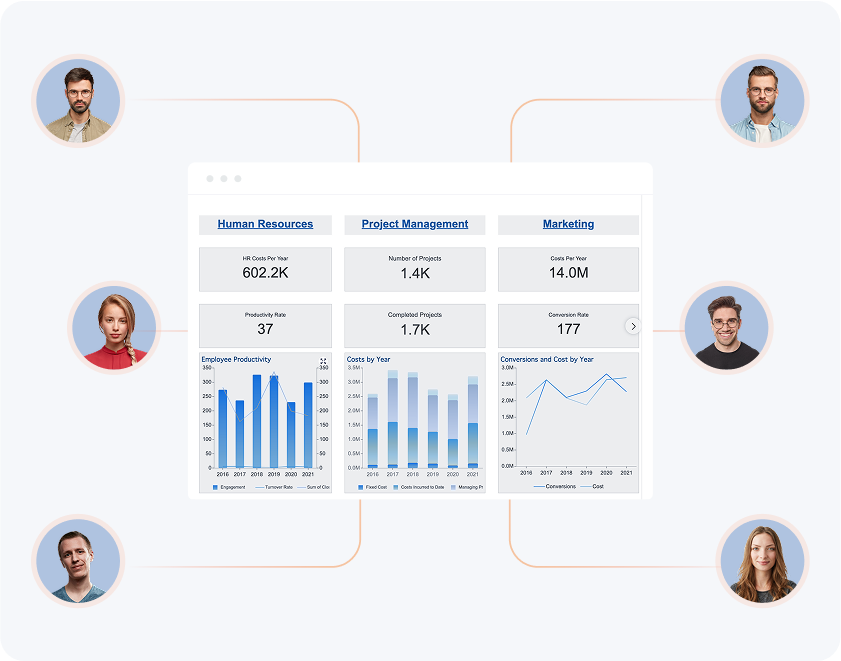
Discover the Story Behind Your Data
Whether it’s your enterprise business or your commercial SaaS application, Wyn empowers your users with a seamless business intelligence solution.
Visualize Trends & Insights
Self-service BI
Lower BI Costs

Real-time, Interactive Dashboards
Modern BI Dashboards
Your dashboards can feature anything fromday-to-day statistics to strategic trend analysis.
- Create ad hoc visualizations and reports with drill-down and cross-filter functionality.
- Generate real-time reporting and detailed visualizations to build a variety of KPIs and dynamic report metrics.

Save Time with Self-Service BI
Designed for self-service BI, Wyn’s easy-to-use dashboardand report designers enable users to develop their own ad-hocdashboards and reports based on the secured data.
Eliminate your dependence on the IT departments and dataanalysts. Offer every end-user (from code-first to code-free) theability to create custom ad hoc reports and interactive dashboards.

Transform the Way You Interact with Data
InsightIQ is a Natural Language Generation Text Scenario that allows you to seamlessly distill your visuals into articulate and easy-to-understand natural language text.
- Summarization of Visualizations: Condense key information into clear and concise text
- Derivation of Insights: Generate insightful narratives that help users make informed decisions
- Text-Based Quick Reviews: Deliver the information you need in a format that is both accessible and efficient
- Automatic Insights for Trends and KPIs: Extract insights related to trends and KPIs

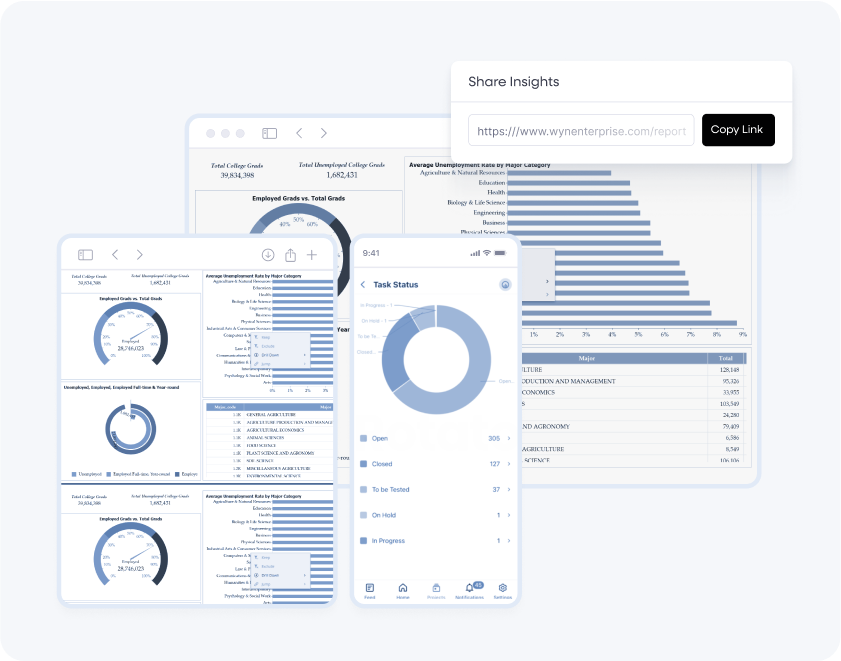
White-label Dashboards
Fully customize your BI dashboards and utilize them with your own custom UI.
- Seamlessly white-label reports and dashboards as part of your own app
- Wyn’s flexible platform has an open API to integrate with any commercial or internal application
- Need a specific visualization for BI Dashboards? Create your own with custom business intelligence visualizations.
- Developers can create custom visualizations, or you can use our library of in-house custom visualizations.

Request a Personalized Demo of Wyn Enterprise
Simplified Data Insights
Empower anyone to create powerful reports and visualizations with intuitive drag-and-drop tools and automated smart suggestions. No coding or data science skills needed.
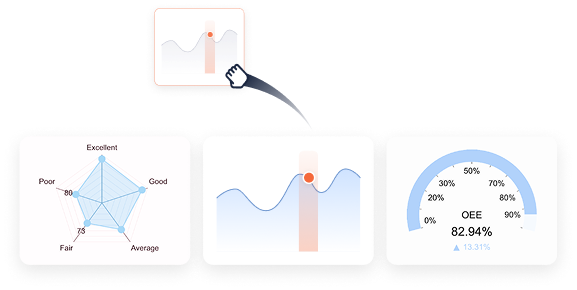
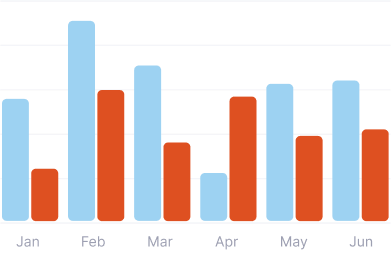
Interactive & Captivating Visualizations
Maps Visualization
Using OpenStreetMap as a base tile layer, and GeoJson data on top of it, users can create interactive map visualizations to better understand geographic data.

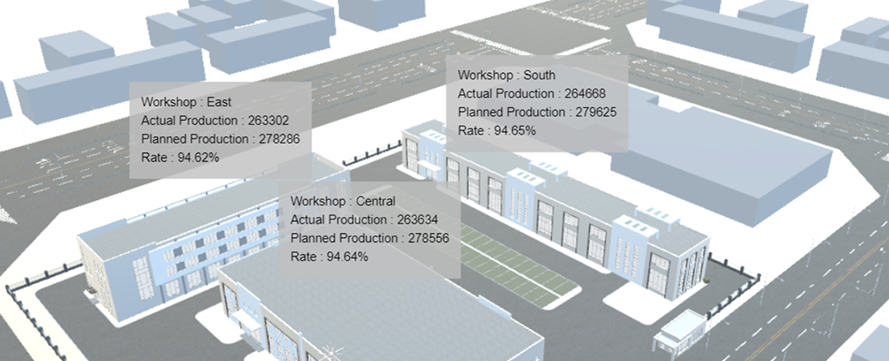
3D Model Visualization
Users can access the 3D scene designer to create 3D model generation and visualization with data. This would be ideal for Manufacturing and Real Estate industries to show a 3D model , like machine parts or building floors.
Additional Visualizations:

Web-Based Portals
-
Once installed, Wyn is 100% web-based
-
- Admins and end-users to easily manage, view, edit, and distribute their dashboards from a centralized portal.
- Distribute to desktop and mobile devices via our web-based portal.
Native Multi-tenancy
-
Once installed, Wyn is 100% web-based
-
- Manage your BI resources and data across all your customers from a single environment.
- A secured centralized environment with built-in support for user context, row-level filters, and role-based security.
Data Access for Dashboards
Push Datasets
Allow an external device/app to send data to Wyn for business intelligence visualization. This can also be used for monitoring control systems/loT devices.
Push Datasets stores data in a cache on the server. So historical data is also available and does not get lost.
Streaming Datasets
Streaming datasets adds the ability to have an external device/app send data to Wyn, which can stream the data to a dashboard.
This is a typical case for monitoring control systems, hardware, and loT devices.
Cached Data
Allow gathering and merging data from multiple different data sources into one model for the dashboard.
This provides analytical expressions in the dashboard for file-based/cloud data sources that do not follow the typical entity-relationship structure.
See Wyn Enterprise in Action
In just 16-minutes, you'll get an end-user demo of Wyn Enterprise and discover the main features.


Loved by industry
experts and real users