-
Interactive DashboardsCreate interactive BI dashboards with dynamic visuals.
-
End-User BI ReportsCreate and deploy enterprise BI reports for use in any vertical.
-
Wyn AlertsSet up always-on threshold notifications and alerts.
-
Localization SupportChange titles, labels, text explanations, and more.
-
Wyn ArchitectureA lightweight server offers flexible deployment.
-
 Wyn Enterprise 7.1 is ReleasedThis release emphasizes Wyn document embedding and enhanced analytical express...
 -
 Choosing an Embedded BI Solution for SaaS ProvidersAdding BI features to your applications will improve your products, better serve your customers, and more. But where to start? In this guide, we discuss the many options.
-
Visual GalleryInteractive sample dashboards and reports.
-
BlogExplore Wyn, BI trends, and more.
-
WebinarsDiscover live and on-demand webinars.
-
Customer SuccessVisualize operational efficiency and streamline manufacturing processes.
-
Knowledge BaseGet quick answers with articles and guides.
-
VideosVideo tutorials, trends and best practices.
-
WhitepapersDetailed reports on the latest trends in BI.
-
 Choosing an Embedded BI Solution for SaaS ProvidersAdding BI features to your applications will impr...
 -

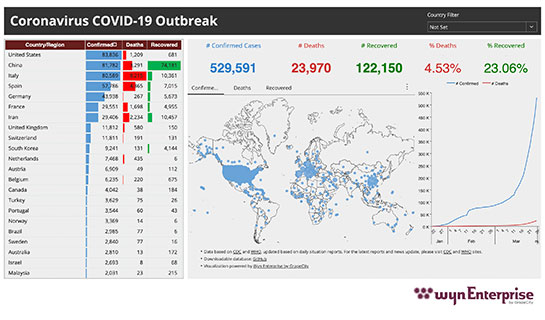
Coronavirus (COVID-19) Global Outbreak
This dashboard visualizes the Coronavirus COVID-19 global outbreak, showing global KPIs and the growth of the disease globally.
With a filter available, the user can interactively focus on a specific country to see the latest data for that country. The data is sourced from WHO and CDC sites through the GitHub resource, managed by JNU.
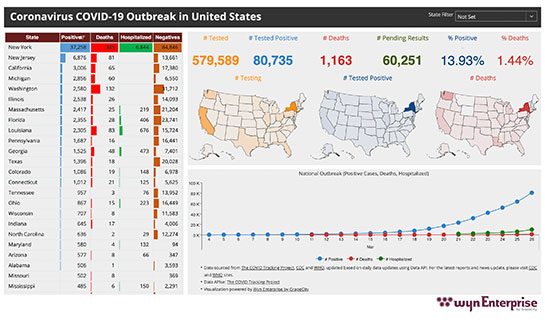
Coronavirus (COVID-19) US Outbreak
The Coronavirus COVID-19 United States Outbreak Dashboard uses local data from different states to show relevant KPIs. It shows the latest information about the outbreak of the disease.
Interactive maps allow for state selection to cross-filter data and get specific state-level numbers. The data is sourced from The COVID Tracking Project’s data APIs.
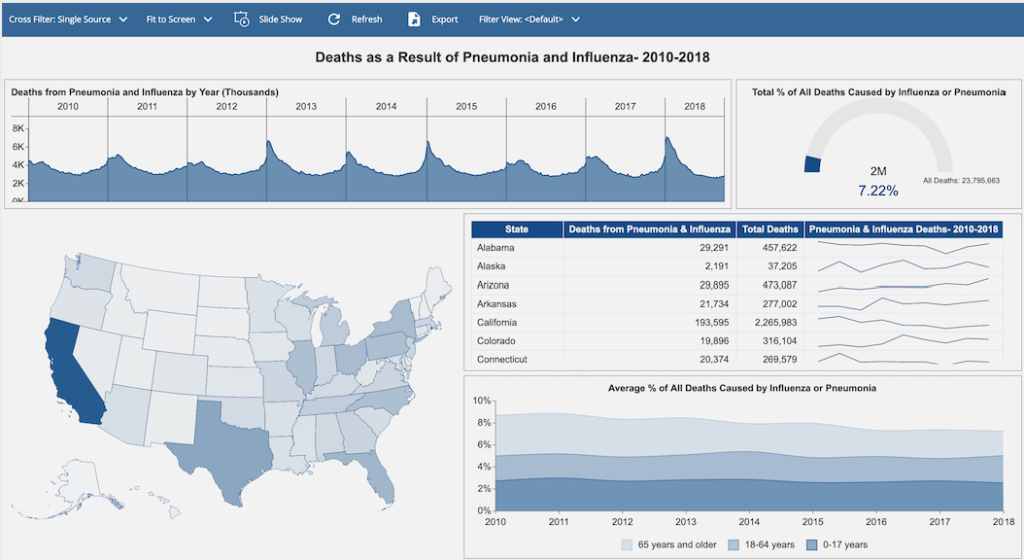
Pneumonia & Influenza
Enhance your understanding of the impacts the pneumonia and influenza over a period of eight years. Gain predictive updates and visualize healthcare KPIs all with the use of an interactive dashboard.


Loved by industry
experts and real users
Whether it’s your business or your commercial SaaS app, embed Wyn and empower users to design, share, and distribute interactive dashboards and reports.


