-
Interactive DashboardsCreate interactive BI dashboards with dynamic visuals.
-
End-User BI ReportsCreate and deploy enterprise BI reports for use in any vertical.
-
Spreadsheet AnalyticsNewLast-Mile Analytics Tool.
-
Narrative Data StoriesThe Next Evolution of Data Storytelling
-
Automated Business DocumentsNewDocument Generation for Smarter Workflows
-
Visual Data Pipeline BuilderDesign Complex Data Flows, Simply.
-
Wyn ArchitectureA lightweight server offers flexible deployment.
-
 Wyn Enterprise 7.1 is ReleasedThis release emphasizes Wyn document embedding and enhanced analytical express...
 -
 Choosing an Embedded BI Solution for SaaS ProvidersAdding BI features to your applications will improve your products, better serve your customers, and more. But where to start? In this guide, we discuss the many options.
-
Visual GalleryInteractive sample dashboards and reports.
-
BlogExplore Wyn, BI trends, and more.
-
WebinarsDiscover live and on-demand webinars.
-
Customer SuccessVisualize operational efficiency and streamline manufacturing processes.
-
Knowledge BaseGet quick answers with articles and guides.
-
VideosVideo tutorials, trends and best practices.
-
WhitepapersDetailed reports on the latest trends in BI.
-
 Choosing an Embedded BI Solution for SaaS ProvidersAdding BI features to your applications will impr...
 -

Everything we do today results in data. Recent studies state that 90% of the world’s total data was generated within the last two years. This has plunged many organizations into an information overload, consequently, the need to have more intelligent, intuitive means of analyzing and interpreting data is needed now more than ever.
CFOs, board members, and managers in the financial industry need to maintain a firm grasp of their current and past performance to develop more precise predictions to make data-driven decisions.
Embedded business intelligence (BI) makes data more accessible by directly integrating real-time reports and interactive dashboards into applications that users use every day. Embedded BI allows finance teams the ability to securely collect and share operational and financial insights across the entire organization.
Benefits of Using Embedded Business Intelligence for Finance
The real-time monitoring of internal processes defends against sudden changes in the financial stability of customers and suppliers.
Other advantages include:
- Predict and capitalize on trends
- Increases profitability
- Reduces risk exposure
- Eliminates data silos
- Enhances collaboration
- Proactive decision making
- Improves insight into consumer behavior
- Reduces risks
Embedded BI for finance provides a roadmap for you to see the larger picture or more granular details, allowing you to concentrate on asking the right questions. There may be questions about decreased sales or shrinking profit margins. From there, everyone in the organization can pinpoint data for actionable insights that propel business growth and solve current pain points.
Eliminate Data Silos and Human Error
Many organizations still operate with data silos, such as isolated spreadsheets. When data silos exist, so do multiple versions of the truth, leading to inaccurate intelligence or insights.
Suppose you manually sift through large amounts of numeric data or use a combination of analytics and spreadsheets to assess information. In that case, you may not efficiently identify various financial or economic patterns. When you are manually manipulating data in any way, it leaves room for human error.
Embedded business intelligence brings disparate data sources together, combines them for easy analysis, and offers a single source of truth. Financial or confidential information is only accessible to authorized users. Admins can ensure the correct data is being funneled to the appropriate user roles or user groups through the BI platform’s data governance and role-based security measures.
Financial Dashboard Examples
Interactive BI dashboards are an important component of a finance BI tool. Finance dashboards offer an easy way to evaluate your financial health.
→ Create a BI dashboard in under 5 minutes.
Your dashboard can be customized for the aspects that you need to concentrate on most. Set up your dashboard so you always have access to your gross profit margin or net profit margin at a glance. You might want to see your burn rate on your dashboard or include information on your accounts receivable turnover.
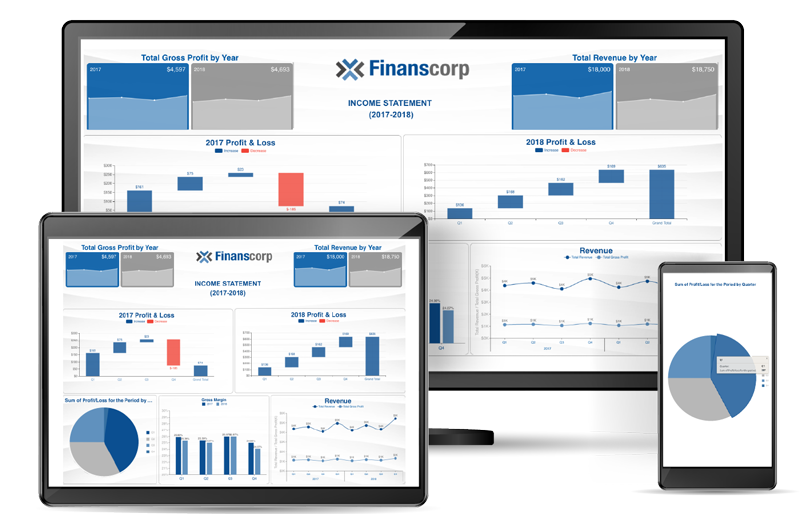
Income Statement Dashboard
Analyze large volumes of data, visualize year-over-year comparisons, and find growth patterns with an Income Statement Dashboard.
Financial Comparison Dashboard
A financial comparison dashboard allows you to uncover market volatility. You can track trends in the industry and identify the problems in your own organization, as well as the strengths.
Wealth Management Dashboard
This type of dashboard would consist of things like your portfolio, wealth scorecard, asset management tools, and credit history tools.
Financial Risk Management Dashboard
A financial risk management dashboard provides tools to help organizations meet regulatory needs, plan budgets, and analyze risks in the market.
Profit and Loss Dashboard
Profit and loss BI dashboards include general bookkeeping or ledgers, balance sheets, annual and monthly earning reports, and budget estimates.
Investment Portfolio Analysis Dashboard
Your investment portfolio analysis dashboard determines financial objectives and investment durations monitors the performance of investments to build and monitors a diversified portfolio.
View our BI dashboard visual gallery →
Data Visualization Tells the Story Behind Your Data
Ultimately, data visualization is a form of storytelling. Visualizing your data can showcase correlations that might get lost in the numbers.
Financial business intelligence software helps to quickly tell the story of what’s happening in your business at a glance. It can help you manage your business, spot warning signs before they become problems, and find areas you can accelerate your growth.

Laurie Smith
Laurie A. Smith is the Product Marketing Manager for Wyn Enterprise. She managed content development at the Developer Tools Division before moving to the Wyn Enterprise Business Intelligence Team. Laurie holds an MFA in Film and Digital Media Production from Chatham University, an MBA & a Master’s Degree in Journalism and Mass Communications from Point Park University in Pittsburgh, PA.
In addition to working in technology, she also loves beekeeping, the horror movie genre, and carefully cultivating sunflowers.
Find her on LinkedIn.


Loved by industry
experts and real users


