-
Interactive DashboardsCreate interactive BI dashboards with dynamic visuals.
-
End-User BI ReportsCreate and deploy enterprise BI reports for use in any vertical.
-
Wyn AlertsSet up always-on threshold notifications and alerts.
-
Localization SupportChange titles, labels, text explanations, and more.
-
Wyn ArchitectureA lightweight server offers flexible deployment.
-
 Wyn Enterprise 7.1 is ReleasedThis release emphasizes Wyn document embedding and enhanced analytical express...
 -
 Choosing an Embedded BI Solution for SaaS ProvidersAdding BI features to your applications will improve your products, better serve your customers, and more. But where to start? In this guide, we discuss the many options.
-
Embedded BIEmbed reporting & analytics within your own custom apps.
-
Self-ServiceEnable users to create custom ad hoc reports and dashboards.
-
MultitenancyEnhance your SaaS apps with a multitenant BI platform.
-
Data Governance and ModelingTransform raw data into insights quickly to reveal trends.
-
Scheduled DistributionSend data insights via scheduled email and chat notifications.
-
Extensible SecurityWyn delivers extensible security for your access control needs.
-
Visual GalleryInteractive sample dashboards and reports.
-
BlogExplore Wyn, BI trends, and more.
-
WebinarsDiscover live and on-demand webinars.
-
Customer SuccessVisualize operational efficiency and streamline manufacturing processes.
-
Knowledge BaseGet quick answers with articles and guides.
-
VideosVideo tutorials, trends and best practices.
-
WhitepapersDetailed reports on the latest trends in BI.
-
 Choosing an Embedded BI Solution for SaaS ProvidersAdding BI features to your applications will impr...
 -

How to Create a Business Intelligence Dashboard in 5 Minutes (Video)
Data visualization plays a significant role in every industry, including finance, healthcare, insurance, manufacturing, retail, and government (to name a few).
With BI dashboards, you can tell a meaningful story. Dashboards graphically represent your data communicating large data sets clearly and efficiently.
Wyn Enterprise is a fully secured enterprise business intelligence software that delivers collaborative self-service reporting and analytics. With Wyn Enterprise, you can build high-value, interactive, and drillable dashboards quickly and easily.
In this video, we’ll create a simple dashboard in less than five minutes.
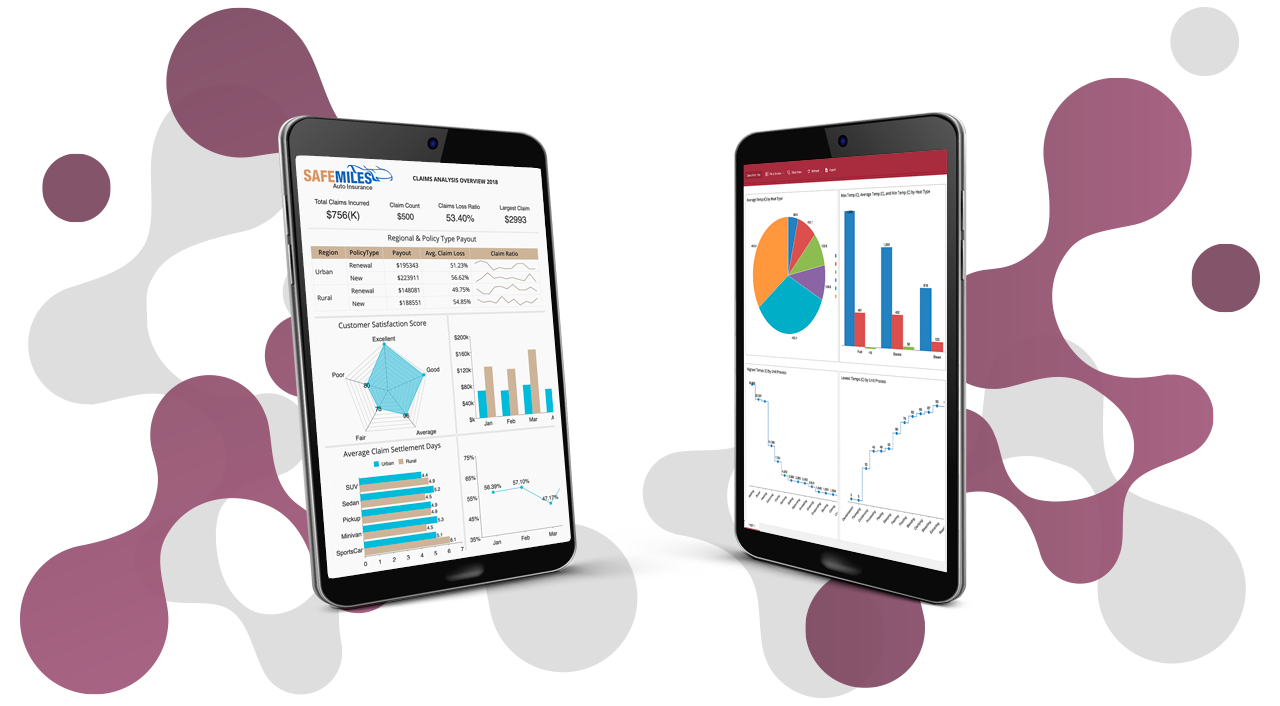
Wyn Dashboards display information through a series of interactive tiles that contain data visualizers, components, and slicers.
We‘ll start by dragging and dropping a line chart on the design area and binding it to Retail data set which is already available to us.
We’ll use this chart to analyze the revenue generated vs year. Watch how easy it is to create a chart from scratch by just dragging and dropping the data fields and see how the chart title is automatically generated.
Easily Customize Your BI Dashboard
You can easily customize it from the Inspector tab. Set up the line style of the chart, provide a custom title, and set the format and display unit settings.
You can also add a sort condition on the data displayed in the chart. Let’s add a map visualizer, snap and align with the line chart, and plot revenue generated for each country.
Add a Stacked Bar Chart
Next, we’ll add a stacked bar chart to our dashboard to plot revenue versus product line and perform some customizations. We also want to display a revenue summary for each year, so, we’ll add a KPI matrix.
Let’s provide a title to our dashboard using a rich text box and a few customizations. Notice that all of Wyn’s visualizers and components are highly configurable. Before we preview our dashboard, we’ll resize the tiles, apply a theme, and enhance the appearance of the map visualizer.
Preview the result. Observe how the tooltips display information for plots on hovering over the charts. Also, our dashboard is highly interactive. You can drill-down by simply clicking on the individual plots or filter the dashboard data by a single click.
That’s it! With Wyn Enterprise you can easily build an interactive and powerful dashboard in less than five minutes.
Better Data Insights = Better Decisions
Let us show you how Wyn Enterprise can provide greater insights into your data.
Learn how to make data insights more attainable, actionable, and valuable. ↓


Ethan Conner
As a Technical Account Manager w ith the Wyn Enterprise team, Ethan loves the collaborative, team-oriented culture. In his spare time, he enjoys playing guitar and drums, learning new technologies, and reading. You can find him on LinkedIn.
Don’t take our word for it.
See what our customers have to say.


Loved by industry
experts and real users
Whether it’s your business or your commercial SaaS app, embed Wyn and empower users to design, share, and distribute interactive dashboards and reports.


