-
Interactive DashboardsCreate interactive BI dashboards with dynamic visuals.
-
End-User BI ReportsCreate and deploy enterprise BI reports for use in any vertical.
-
Spreadsheet AnalyticsNewLast-Mile Analytics Tool.
-
Narrative Data StoriesThe Next Evolution of Data Storytelling
-
Automated Business DocumentsNewDocument Generation for Smarter Workflows
-
Visual Data Pipeline BuilderDesign Complex Data Flows, Simply.
-
Wyn ArchitectureA lightweight server offers flexible deployment.
-
 Wyn Enterprise 7.1 is ReleasedThis release emphasizes Wyn document embedding and enhanced analytical express...
 -
 Choosing an Embedded BI Solution for SaaS ProvidersAdding BI features to your applications will improve your products, better serve your customers, and more. But where to start? In this guide, we discuss the many options.
-
Visual GalleryInteractive sample dashboards and reports.
-
BlogExplore Wyn, BI trends, and more.
-
WebinarsDiscover live and on-demand webinars.
-
Customer SuccessVisualize operational efficiency and streamline manufacturing processes.
-
Knowledge BaseGet quick answers with articles and guides.
-
VideosVideo tutorials, trends and best practices.
-
WhitepapersDetailed reports on the latest trends in BI.
-
 Choosing an Embedded BI Solution for SaaS ProvidersAdding BI features to your applications will impr...
 -

Embedded BI is the integration of BI solutions within business process software. Instead of using a standalone application, embedded BI enables business intelligence directly within an organization’s application.
Embedded BI provides critical to day-to-day operations and long-term strategic planning by providing actionable insights into the same environment as other business applications.
You can embed Wyn’s Dashboard Viewer and Designer components in your own custom internal applications or commercial websites using two methods:
Wyn Dashboards API
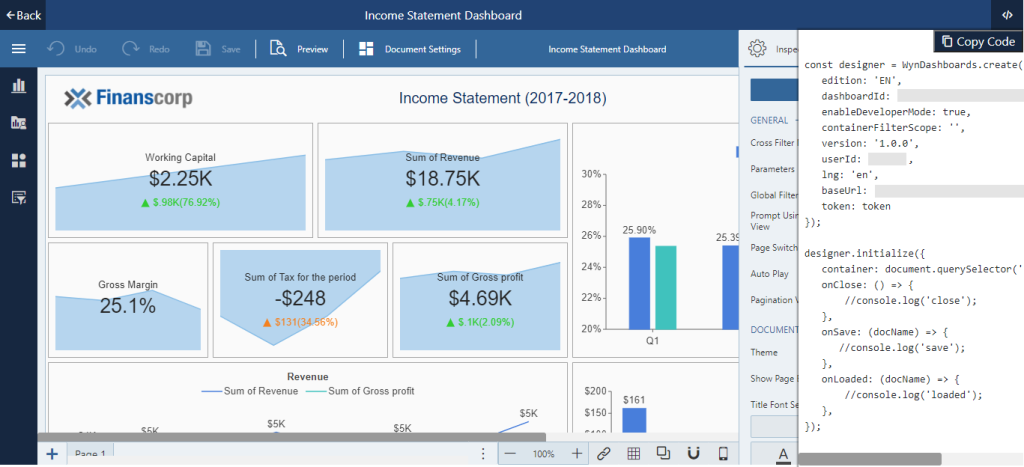
In this article, we’ll develop a simple web application and embed the Viewer and Designer components using div and the Wyn Dashboards API. We’ll achieve something like the below once we implement these APIs.
Here is the sample showing the integration of Wyn Designer & Viewer using Div in a web application.
Viewer
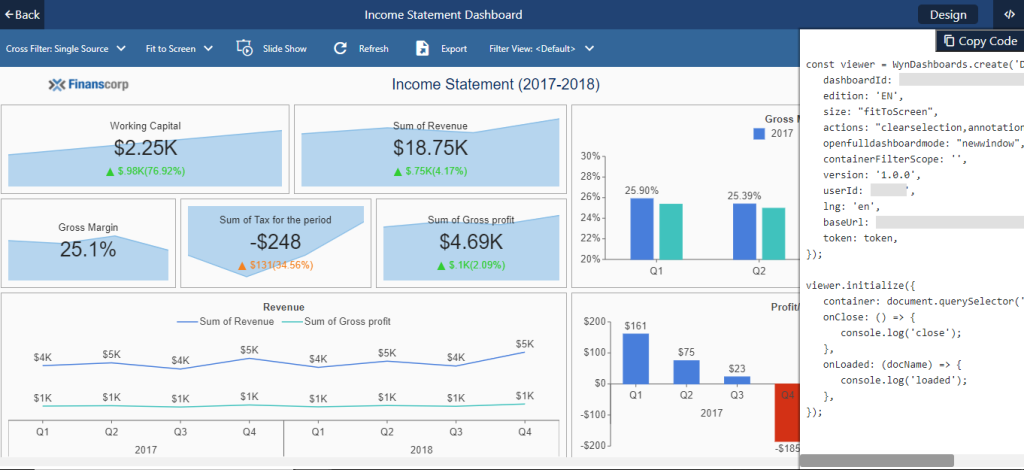
Designer
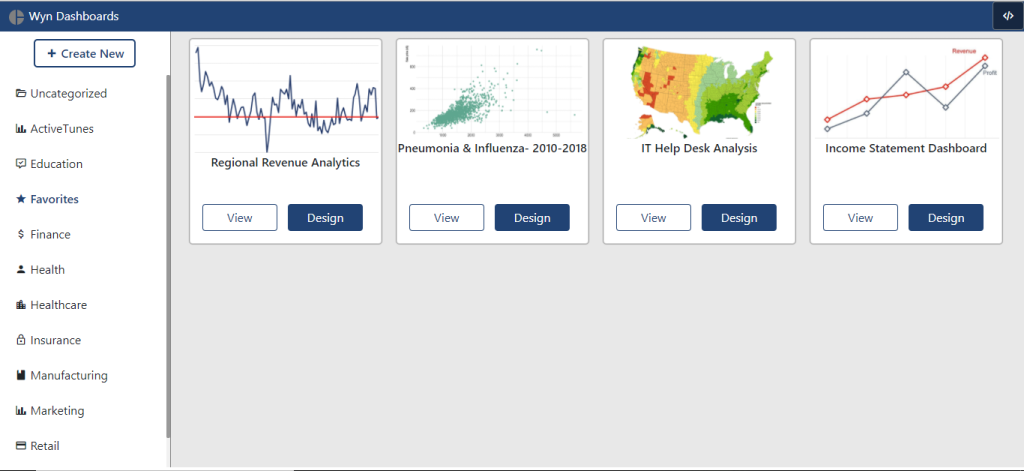
Get Categories and Dashboards
To get started, let’s fetch the list of categories and dashboards stored on the Wyn Server. For this, we’ll send two graphql requests using ajax as below:
graphql
function graphqlRequest(query) {
    return $.ajax({
        url: wynUrl + '/api/graphql?token=' + token,
        type: 'POST',
        data: JSON.stringify({
            query: query,
        }),
        dataType: 'json',
        contentType: 'application/json',
        processData: true,
        headers: getDefaultHeaders(),
        xhrFields: {
            withCredentials: true,
        }
    });
}
Get Categories
function getCategoriesList() {
    return graphqlRequest(
        'query { ' +
        'tags { ' +
        'id,' +
        'name,' +
        'parentId,' +
        'color,' +
        'iconCssClass,' +
        'isFavorites, ' +
        '} ' +
        '}'
    ).then(function (result) {
        console.log(result);
        var categoriesList = getValue(result, 'data.tags') || [];
        return categoriesList;
    });
}
Get Dashboards
function getDashboardsList() {
    return graphqlRequest(
        'query { ' +
        'documenttypes(key: \"dbd\") { ' +
        'documents(orderby: \"-created\") { ' +
        'id, ' +
        'description, ' +
        'type,' +
        'title, ' +
        'tags {id, name}, ' +
        'created_by { name }, ' +
        'created, ' +
        'modified_by { name }, ' +
        'modified, ' +
        '} ' +
        '} ' +
        '}'
    ).then(function (result) {
        console.log(result);
        var dashboardsList = getValue(result, 'data.documenttypes.0.documents') || [];
        return dashboardsList;
    });
}
Now that we have the list of categories and dashboards, we can show them in our application as a list and a grid of cards. You may choose to display them as required in your application.
Let’s dive into the APIs and see how we can use them to develop faster and more intuitive BI web applications.
API References
Wyn Dashboards API gets installed with the installation of Wyn Enterprise Server. To use it in our application, we need to add references to the scripts and theme libraries, just as we would for any other library (e.g., bootstrap).
Wyn Dashboard Theme
<link rel="stylesheet" href="http://<WynServerUrl>/api/themefiles/dashboard.vendor.css?theme=dark-forest&version=4.1.16187.0&plugin=dashboards" />
<link rel="stylesheet" href="http://<WynServerUrl>/api/themefiles/dashboard.app.css?theme=dark-forest&version=4.1.16187.0&plugin=dashboards" />
Wyn Dashboard Scripts
<script src="http://<WynServerUrl>/lib/polyfills.js"></script>
<script src="http://<WynServerUrl>/api/PluginAssets/dashboards-4.1.16187.0/dashboard.common.js"></script>
<script src="http://<WynServerUrl>/api/PluginAssets/dashboards-4.1.16187.0/dashboard.table.js"></script>
<script src="http://<WynServerUrl>/api/PluginAssets/dashboards-4.1.16187.0/dashboard.dialog.js"></script>
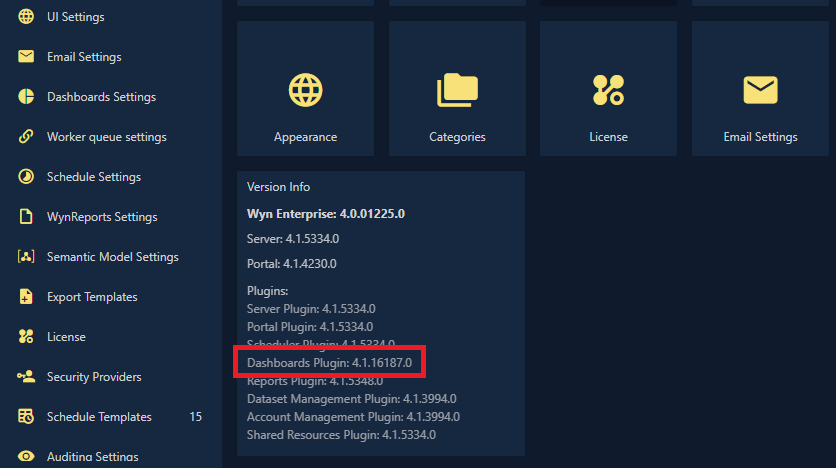
<script src="http://<WynServerUrl>/api/PluginAssets/dashboards-4.1.16187.0/dashboard.app.js"></script>Note: The version specified in the above references must be the same as that of the Dashboards Plugin that is installed on the Wyn Server. It can be found through the Admin Portal.
Viewer
The Viewer component is created by passing ‘DashboardViewer’ as the first argument to WynDashboards’ create method. The second argument of this method contains the various parameters that need to be sent along with the create request.
var viewer = WynDashboards.create('DashboardViewer', {
                dashboardId: docId, //Id of the document to View
                edition: 'EN',
                size: "fitToScreen",
                actions: "clearselection,annotation,analysispath",
                openfulldashboardmode: "newwindow",
                containerFilterScope: '',
                version: '1.0.0',
                userId: username, //User name
                lng: 'en',
                baseUrl: wynUrl, //Url of Wyn Server
                token: token, //Access token
});
Designer
The Designer component is created by passing ‘DashboardDesigner’ as the first argument to WynDashboards’ create method. The second argument of this method contains the various parameters that need to be sent along with the create request.
var designer = WynDashboards.create('DashboardDesigner', {
                edition: 'EN',
                dashboardId: docId,
                enableDeveloperMode: true,
                containerFilterScope: '',
                version: '1.0.0',
                userId: username,
                lng: 'en',
                baseUrl: wynUrl,
                token: token
            });
The parameters in focus are:
- dashboardId – the Id of the dashboard to view/design
- userId – username of the user
- baseUrl – Wyn Server Url
- token – access token retrieved on logging in
Embedding Dashboards using div
Now to show the Viewer and Designer in the application, we’ll add two div tags and initialize them as below:
<div id="designer"></div>
<div id="viewer"></div>
Viewer
viewer.initialize({
   container: document.querySelector('#viewer'),
   onClose: () => {
      //console.log('close');
   },
   onLoaded: (docName) => {
      //console.log('loaded');
   },
});
Designer
designer.initialize({
   container: document.querySelector('#designer'),
   onClose: () => {
      //console.log('close');
   },
   onSave: (docName) => {
      //console.log('save');
   },
   onLoaded: (docName) => {
      //console.log('loaded');
   },
});
Embedding Individual Scenarios using div
In addition to embedding the entire dashboard using div, Wyn Dashboards API also provides the ability to embed individual scenarios. To embed individual scenarios, we need to specify an additional option ‘scenario’ with the scenario’s name as its value, when creating the Viewer’s object.
viewer = WynDashboards.create('DashboardViewer', {
    scenario: "column-3",
    dashboardId: docId,
    edition: 'EN',
    size: "fitToScreen",
    actions: "clearselection,annotation,analysispath",
    openfulldashboardmode: "newwindow",
    containerFilterScope: '',
    version: '1.0.0',
    userId: username,
    lng: 'en',
    baseUrl: wynUrl,
    token: token,
});
The Viewer with an individual scenario would look like this:

If you have questions about this article, reach by email or contact support.
Embedding Wyn Enterprise – Additional Resources
For language packs, samples, and custom visuals, explore our GitHub .
Embedding Wyn Enterprise in an Application via API – Part I
Here, we’ll integrate Wyn into a React application with the help of Wyn’s API endpoints.
Embed Individual Dashboard Scenarios into a Web App
An overview of Wyn’s embeddable BI capabilities and integrate a single scenario/visualization from a complete dashboard.
Hosting Wyn in a Web Application via iFrame
Here, we’ll integrate Wyn Enterprise in an ASP.NET Core app via iFrame.
Embedding Wyn Enterprise in a Web App via ReportViewer
How to embed Wyn Enterprise in a Web App using Wyn’s own ReportViewer.
Understand the Story Behind Your Dat
Wyn is a web-based BI and data analytics platform that provides greater insight into your data.
Wyn offers built-in tools for report and dashboard creation, data governance, security integration, embedded BI, automated document distribution, and a business-user friendly interface for self-service business intelligence.
Learn more about Wyn Enterprise:


Abdias Michael
A veteran of the technical team, Senior Software Engineer Abdias Michael loves working with new technologies and focusing on providing quality solutions to customers. In his spare time, he enjoys traveling, playing guitar, and badminton. He has a Bachelor of Engineering degree from Dronacharya College of Engineering. You can find him on Twitter at @abdiasm.


Loved by industry
experts and real users