-
Interactive DashboardsCreate interactive BI dashboards with dynamic visuals.
-
End-User BI ReportsCreate and deploy enterprise BI reports for use in any vertical.
-
Narrative Data StoriesThe Next Evolution of Data Storytelling
-
Visual Data Pipeline BuilderDesign Complex Data Flows, Simply.
-
Wyn ArchitectureA lightweight server offers flexible deployment.
-
 Wyn Enterprise 7.1 is ReleasedThis release emphasizes Wyn document embedding and enhanced analytical express...
 -
 Choosing an Embedded BI Solution for SaaS ProvidersAdding BI features to your applications will improve your products, better serve your customers, and more. But where to start? In this guide, we discuss the many options.
-
Visual GalleryInteractive sample dashboards and reports.
-
BlogExplore Wyn, BI trends, and more.
-
WebinarsDiscover live and on-demand webinars.
-
Customer SuccessVisualize operational efficiency and streamline manufacturing processes.
-
Knowledge BaseGet quick answers with articles and guides.
-
VideosVideo tutorials, trends and best practices.
-
WhitepapersDetailed reports on the latest trends in BI.
-
 Choosing an Embedded BI Solution for SaaS ProvidersAdding BI features to your applications will impr...
 -

Business intelligence enhances supply chain management by making real-time data analytics in supply chain accessible. Self-service BI takes this a step further by allowing users to run their own queries and create their own reports, even if they don’t have a background in statistical analysis. Business intelligence logistics can support every step of this process, especially when paired with an enterprise reporting solution that centralizes critical insights.
Here, we’ll discuss how BI can provide real-time insights into supply chain emerging risks, inefficiencies, and anomalies, allowing organizations to quickly isolate and resolve potential problems using supply chain predictive analytics.
Supply Chain Disruptions
We saw unprecedented disruption to supply chains in 2020 that caused problems for companies and consumers. The Federal Reserve reports continued supply chain and logistics disruptions in 2021 are emerging at the same time demand is increasing. Business intelligence supply chain solutions are critical for navigating these disruptions in supply chain management. New data from the New York Fed’s Global Supply Chain Pressure Index shows that, while pressure has fallen back toward normal levels since the post‑2021 peak, global frictions remain elevated due to ongoing port delays and geopolitical challenges. Meanwhile, a recent Federal Reserve Bank of Richmond brief (January 2025) notes that supply chain shocks now account for over 50 % of a disruption’s total impact — about half of any future economic shock may be amplified through these networks. Additionally, Chicago Fed President Austan Goolsbee warned in February 2025 that supply‑chain disruptions stemming from new tariffs and trade policy volatility are “still significant”.
For companies struggling to manage supply chains, it’s a significant issue. Supply chains represent as much as half of the value of a company’s products or services. Business analytics in supply chain can help optimize this value. Flexible BI platforms with flat-fee BI licensing are especially attractive because they allow organizations to scale analytics across departments without unpredictable costs.
Failing to manage the supply chain efficiently, leads to ongoing problems, including:
- Less resilient to market changes
- Less efficient
- Decreased inventory
- Inability to meet demand
- Decreased financial performance
As many as 94% of Fortune 1000 companies reported supply chain disruptions during the past year. Three-quarters of organizations said it had a significant negative impact on their business. Supply chain analytics can help companies understand and mitigate these disruptions.
One thing we learned during the pandemic was the need to actively manage the supply chain to source products to keep cash flowing. As Accenture’s recent report on supply chain disruption stated, “strong data and analytics capabilities are crucial in understanding complexity, anticipating potential disruption, and quickly developing a response.” Data analytics in supply chain enables these capabilities.
Managing the Supply Chain with Embedded BI
Embedded BI integrates business intelligence reporting tools into everyday apps. Embedded business intelligence logistics tools provide ad hoc reporting, interactive BI dashboards, scheduling, and distribution tools within your custom apps, enabling supply chain analytics at every level.
When you embed business intelligence tools into your decision chain, it provides quick access to the insights team members need. Potential supply chain problems can be spotted in real-time for faster resolution, helping your supply chain management stay agile.
View our report and interactive BI dashboard gallery. →
Visualizing Demand and Inventory
Data visualization makes it easier to manage inventory by providing a visual reference for current inventory levels and pending orders. This makes it easier to forecast inventory needs and set reorder points using data analytics in supply chain tools for improved supply chain management.
Visualizing Distribution
You can also visualize the movement of goods and material through your supply chain into your inventory and out the door to customers. By monitoring order status, you can also see potential disruptions in your supply chain or your processes. Business analytics in supply chain improves this transparency, while supply chain predictive analytics can help anticipate issues before they arise.
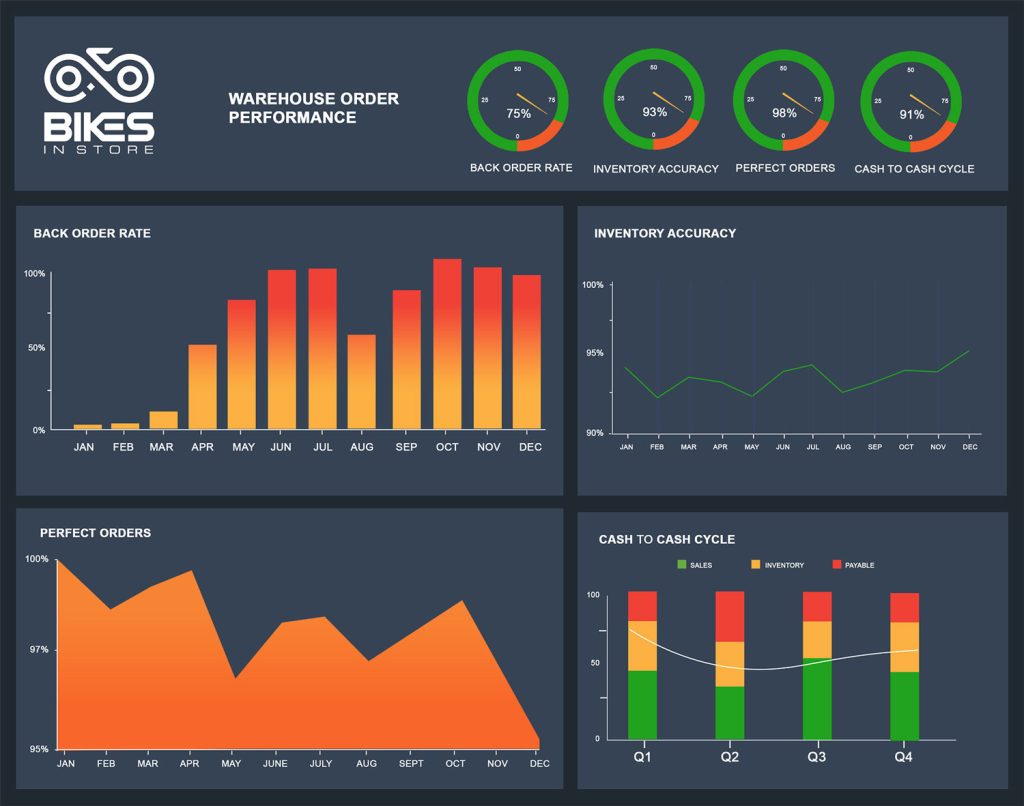
Supply Chain BI Dashboard – Warehouse Order Performance
Tracking KPIs Easily with an Interactive BI Dashboard
Using a BI dashboard, you can track the Key Performance Indicators (KPIs) in multiple ways. You can customize your dashboard any way you want to provide an overview of your KPIs. With an interactive BI dashboard, you also have the ability to drill down into the data at a more granular level to assess the underlying details, supporting your supply chain analytics and business intelligence supply chain initiatives.
While your KPIs can be adjusted to fit your business needs, here are some of the more common KPIs that organizations are tracking to manage their supply chain.
- Perfect Orders: On-time, in-full deliveries that are free from damage
- Cash to Cycle Time: Days between paying for materials and getting paid for sales
- Customer Order Cycle Time: Time between receiving an order and delivery
- Fill Rates: Percentage of orders, line, or units shipped on the first attempt
- Days of Supply: How long you can go without restocking/reordering
- Payments Outstanding: How quickly you are collecting from customers
- Turnover: How efficiently you turn working capital invested in inventory into profit
- Inventory Velocity: Track best sellers and poor performers
- Gross ROI: Show profitability from inventory investments
A challenge for many organizations is tracking the supply chain across multiple vendors.
Interactive BI dashboards allow you to merge data from multiple sources to create interactive modules for quick comparisons and tracking, , using business intelligence logistics for efficiency.
Customize your Interactive Dashboard
Besides showing which KPIs you choose, you can also customize the dashboard itself in multiple ways.
For example, with the Wyn Dashboard, you can quickly configure ad hoc visualizations for real-time reporting and customize styles, look, and representations. You can use visualization SDKs to define the specification of your visualizations. Some examples include:
- Wave charts provide animated shapes filled with “liquid” which rise and fall depending on the percentage achievement of target goals.
- Gantt charts provide a visual view of tasks scheduled. Most commonly used in project management, this can also track inventory
- Waterfall charts visualize the cumulative result of sequential positive and negative (increase/decreases) values.
Interactive dashboards can also be customized by roles so different team members can see different visualizations. For example, the Wyn interactive dashboard for data visualization can track supply chain P&L and other financial data specifically for your CFO.
This allows team members to track the metrics across the supply chain specific to their role in the organization and leverage business analytics in supply chain and supply chain analytics for more informed decisions.
Better Inventory Management = Greater Profitability
Every piece of inventory you store costs you money. Too much inventory or raw material can result in excess holding fees and tie-up cash that could be used in other areas of the business. At the same time, poor supply chain management can leave you with a lack of inventory or the materials you need. This can lead to bottlenecks in your manufacturing production pathway, backorders, or lost sales.
When you can monitor your inventory at a glance, and manage your supply chain, you can better forecast demand and optimize your ordering process. Better storage flow to meet demand creates efficiencies. It saves money and helps you keep your cash flow healthy by utilizing data analytics in supply chain.
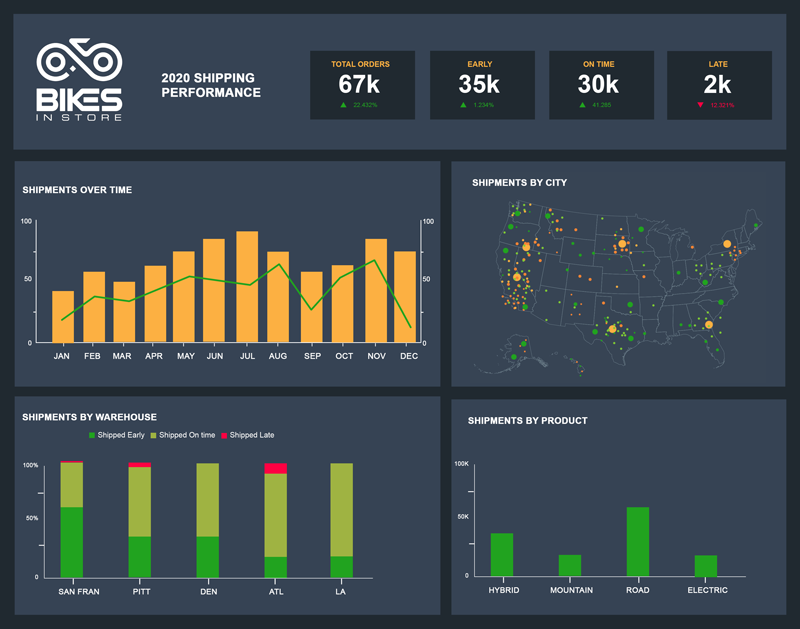
Supply Chain Dashboard – Shipping KPIs
The Benefits of Embedded Analytics in Your Workflow
When you can integrate BI visualizations into your business workflow, it becomes a powerful tool for analysis and decision-making. Visualization dramatically reduces the learning curve by displaying information visually and allowing users to benefit immediately, supporting business intelligence supply chain initiatives.
Embedding analytics and BI throughout your organization provides other significant benefits, including:
- Allows easier data collection and sharing with a remote or distributed workforce
- Real-time data analysis at a glance
- Low initial costs and total cost of ownership (TCO)
- Enhancing collaboration
- Customization for users
- Allows non-technical users to create interactive dashboards and reports on the fly
Not only can you create stand-alone interactive dashboards, but Wyn Dashboards can be embedded within your business process software. This helps team members to see critical information without having to toggle back and forth between software platforms, leveraging business analytics in supply chain for greater productivity.
Most importantly, embedding BI in your organization creates a data-driven culture. As markets shift, consumer demand change, supply chains get disrupted, or competitors roll out new products, new threats and opportunities can be uncovered more quickly. This leads to better business intelligence to make data-driven decisions.
Business Intelligence Offers Transparency in the Supply Chain
More than ever, customers are demanding transparency in the supply chain. While of interest to customers, supply chain management is of crucial importance to businesses. Supply chain analytics helps make this possible.
By mapping and monitoring the supply chain, businesses can visualize the flow of goods through the system. This helps to better understand the flow from suppliers and surface potential concerns before they become problems.
FAQ: Business Intelligence in the Supply Chain
1. How does business intelligence improve supply chain management?
Business intelligence (BI) gives organizations real-time visibility into supply chain operations. BI tools help monitor inventory, track shipments, and analyze supplier performance, enabling faster decision-making and improved efficiency throughout the supply chain.
2. What are examples of business intelligence applications in the supply chain?
Common BI applications include demand forecasting, inventory optimization, supplier scorecards, and real-time logistics dashboards. These tools use data analytics to highlight trends, detect disruptions, and help businesses respond proactively.
3. How can supply chain analytics drive business growth?
Supply chain analytics enable organizations to identify inefficiencies, predict market changes, and optimize resource allocation. With accurate analytics, businesses can reduce costs, increase agility, and improve service levels directly impacting profitability and customer satisfaction.
4. What is supply chain predictive analytics and why is it important?
Supply chain predictive analytics uses historical and real-time data to forecast demand, anticipate disruptions, and optimize processes. This approach helps businesses minimize risks, prevent stockouts or overstocking, and ensure smooth operations.
5. How do embedded business intelligence solutions support logistics?
Embedded BI solutions bring analytics and reporting directly into logistics platforms. This integration gives teams instant access to key metrics like shipping status or route efficiency without switching between tools, boosting productivity and visibility.
6. What are key benefits of real-time data analytics in supply chain management?
Real-time data analytics helps organizations detect supply chain bottlenecks, manage inventory more effectively, and respond quickly to market changes. This leads to better planning, reduced lead times, and higher customer satisfaction.
7. How does business intelligence help mitigate supply chain risks?
BI tools provide early warnings of disruptions, enable scenario planning, and monitor supplier reliability. This risk visibility allows companies to take proactive steps like diversifying suppliers or adjusting inventory to reduce impact from unexpected events.
8. Can business intelligence solutions be customized for different industries?
Yes, BI solutions can be tailored for industries such as manufacturing, retail, healthcare, and logistics. Custom dashboards and reports ensure organizations track the metrics that matter most for their specific supply chain needs.
9. What features should you look for in a supply chain BI platform?
Look for customizable dashboards, real-time reporting, data integration, predictive analytics, role-based security, and scalability. A strong supply chain BI platform should support collaboration and make insights accessible to both technical and non-technical users.
10. Why choose Wyn Enterprise for supply chain business intelligence?
Wyn Enterprise offers robust, embedded BI with interactive dashboards, real-time analytics, and unlimited user licensing. Its platform is embeddable and fully customizable, empowering organizations to visualize, analyze, and act on supply chain data all within their daily workflows.


Loved by industry
experts and real users