Platform
-
Interactive DashboardsCreate interactive BI dashboards with dynamic visuals.
-
End-User BI ReportsCreate and deploy enterprise BI reports for use in any vertical.
-
Narrative Data StoriesThe Next Evolution of Data Storytelling
-
Visual Data Pipeline BuilderDesign Complex Data Flows, Simply.
-
Wyn ArchitectureA lightweight server offers flexible deployment.
Use Cases
Add On
Featured from Blog
-
 Wyn Enterprise 7.1 is ReleasedThis release emphasizes Wyn document embedding and enhanced analytical express...
 -
 Choosing an Embedded BI Solution for SaaS ProvidersAdding BI features to your applications will improve your products, better serve your customers, and more. But where to start? In this guide, we discuss the many options.
Resource Library
-
Visual GalleryInteractive sample dashboards and reports.
-
BlogExplore Wyn, BI trends, and more.
-
WebinarsDiscover live and on-demand webinars.
-
Customer SuccessVisualize operational efficiency and streamline manufacturing processes.
-
Knowledge BaseGet quick answers with articles and guides.
-
VideosVideo tutorials, trends and best practices.
-
WhitepapersDetailed reports on the latest trends in BI.
New Guide
-
 Choosing an Embedded BI Solution for SaaS ProvidersAdding BI features to your applications will impr...
 -

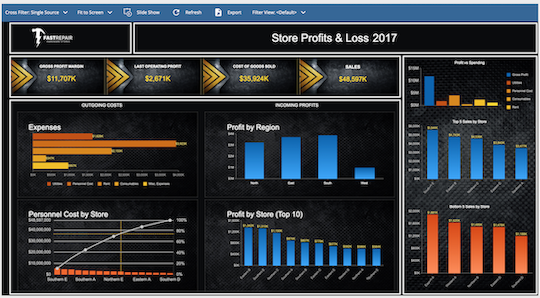
Profits and Loss
A profits and loss CFO dashboard connect mixed profit-and-loss data into one dashboard. Visualize critical financial measures such as COGS, net sales, net profit, and profit vs. spending per region.
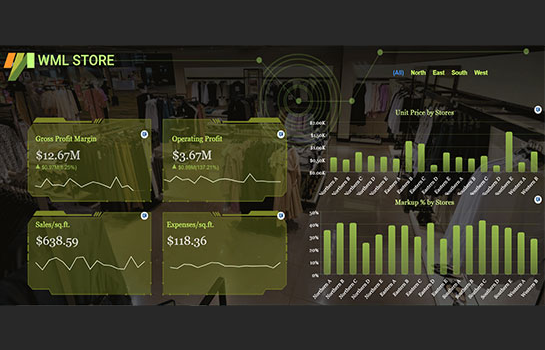
Sales Analysis
Visualize your gross profit margin, expenses, operating profit, store unit price, markup percentages, and more with an interactive retail dashboard.
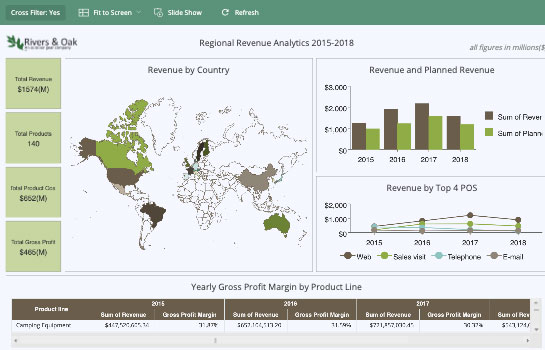
Regional Revenue Analytics
See data in new ways.
Seamlessly intersect your data from planned and forecasted revenue findings and profit margins to the point of sale transactions—all with one dashboard.
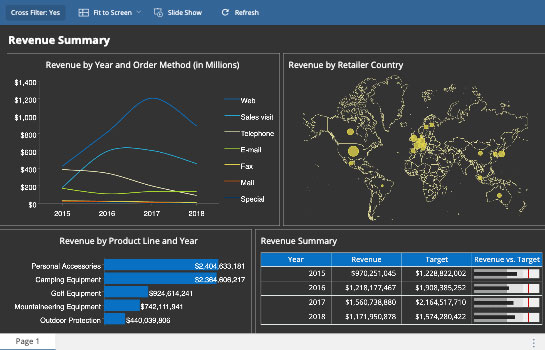
Revenue Summary
Showcase revenue streams by geography, product line, and order methods, all in one view. Build a compelling story visually.

“Wyn is a great tool with an awesome support team.”
Wyn has been a game-changing addition to our tech stack. It has enabled us to save a massive amount of time for our engineering team by pushing more of the workload to BI-focused team members such as myself, and has allowed us to create new deliverables for clients at a speed that is unmatched.
Charles B.
President, Small-Business

“Writing reports are easy to use as well as very flexible to meet customers' needs.”
Love the flexibility of creating reports from simple to very complicated. I have yet to find something that Wyn Enterprise hasn't been able to support. We also use Wyn Enterprise for a lot of our internal documents as well that are on a monthly scheduler to automatically execute.
Dwane B.
Business Analyst, Enterprise Business

“Remarkably simple yet very powerful”
Simple to install and deploy, great customer support and service. And support team have been AWSOME, always quick to answer a question or get you the resources you need to make your project a success.
Stephen J.
Director IT, Small-Business

“Great reporting platform and support team”
The reporting platform continues to evolve and keep up with changes in technology; the support team is solid and responds quickly, and the product team listens and responds to feedback and product needs. Our software solution requires a flexible reporting platform that allows users to run canned reports and build their own and this is a pretty good fit.
Ian P.
Product Development, Small-Business
social proofs
Loved by industry
experts and real users
Whether it’s your business or your commercial SaaS app, embed Wyn and empower users to design, share, and distribute interactive dashboards and reports.


Ready to Learn More?
Request a demo with one of our embedded BI experts or get a free trial.


×