-
Interactive DashboardsCreate interactive BI dashboards with dynamic visuals.
-
End-User BI ReportsCreate and deploy enterprise BI reports for use in any vertical.
-
Narrative Data StoriesThe Next Evolution of Data Storytelling
-
Visual Data Pipeline BuilderDesign Complex Data Flows, Simply.
-
Wyn ArchitectureA lightweight server offers flexible deployment.
-
 Wyn Enterprise 7.1 is ReleasedThis release emphasizes Wyn document embedding and enhanced analytical express...
 -
 Choosing an Embedded BI Solution for SaaS ProvidersAdding BI features to your applications will improve your products, better serve your customers, and more. But where to start? In this guide, we discuss the many options.
-
Visual GalleryInteractive sample dashboards and reports.
-
BlogExplore Wyn, BI trends, and more.
-
WebinarsDiscover live and on-demand webinars.
-
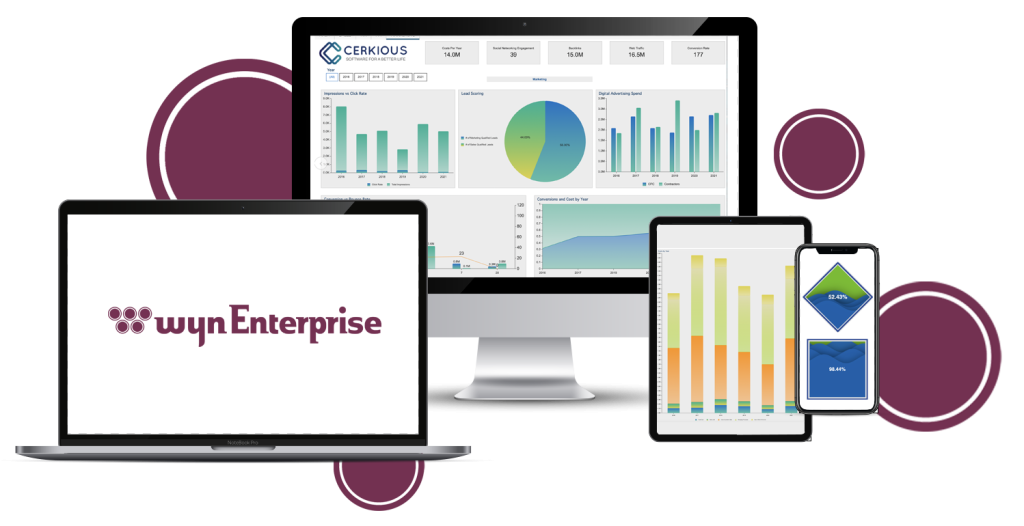
Customer SuccessVisualize operational efficiency and streamline manufacturing processes.
-
Knowledge BaseGet quick answers with articles and guides.
-
VideosVideo tutorials, trends and best practices.
-
WhitepapersDetailed reports on the latest trends in BI.
-
 Choosing an Embedded BI Solution for SaaS ProvidersAdding BI features to your applications will impr...
 -

As business intelligence (BI) continues to play an integral role in the decisions of enterprises across all industries, it is important to understand BI essentials. Business intelligence and dashboarding helps modern, technology-driven organizations analyze data and use it to inform critical decisions in both short-term and long-term operations. Here, we’ll investigate Business Intelligence’s most important visualization method: dashboarding, and discuss dashboard business intelligence software features. For budget planning and vendor comparisons, many teams also evaluate BI platform pricing early in the process.
In this article, we’ll cover what a BI dashboard is, how a BI dashboard can be used, the industries that can benefit from BI dashboards, how your organization can benefit from BI dashboards, and other things to consider when creating and consuming BI dashboards. Business intelligence dashboard examples will also be referenced to illustrate real-world usage. Modern implementations emphasize interactive business intelligence dashboards that surface the right KPIs to the right users.
Before delving into the details of BI dashboards, it’s important to understand the fundamentals of dashboarding. Business intelligence dashboard tools are increasingly important for organizations of all sizes.
- What is a BI dashboard?
- Who creates BI dashboards?
- What is the purpose of a BI dashboard?
What is a business intelligence dashboard?
A BI dashboard is an interactive visualization method for displaying different types of data for business operations on various scales. The types of data typically found in BI dashboards are analytics metrics, key performance indicators (KPIs), and other data points that play a role in decision-making. With bi dashboard solution features, you can optimize how you visualize your information. When reporting requires print-ready layouts, teams complement dashboards with pixel-perfect BI reports for audit and regulatory needs.
Business intelligence key performance indicators are often presented on BI dashboards to drive actionable decisions and monitor business health.
Examples of Data Types Found in BI Dashboards
- Analytics metrics: How many customers did we lose/gain this year? What two products were most often bought together? How long was the typical evaluation time per product?
- KPIs: Growth in Revenue, Net Profit Margin, Gross Profit Margin, Operational Cash Flow, Inventory Turnover
- Miscellaneous: What time of day do customers most often purchase this product? What is the average age of the customer?
BI dashboards can contain an abundance of data types, but all BI dashboards should present actionable data to inform business decisions – this alone is what defines a dashboard as a business intelligence dashboard. Many business intelligence dashboard examples highlight the power of visualizing such key data points.
Why Use a BI Dashboard?
We’ve covered what type of information BI dashboards can provide – KPIs, business analytics metrics, and other key data points to help make informed, data-driven decisions. You may be asking yourself, “Why can’t I present this information in a report? Why a dashboard?” Dashboard business intelligence software makes it easier to interact with and interpret this information visually.
If you’re asking something along these lines, don’t worry. It is a common misconception that a dashboard and a report are the same. With business intelligence dashboard tools, the difference becomes clear.
Dashboards vs. Reports
Here is a basic explanation of the difference:
- Dashboards are generally summary-focused. Reports generally data-focused.
- Dashboards are more visual and use various data visualization components. Reports are generally more tabular.
- Dashboards focus on analytical metrics and KPIs. Reports focus on the data behind these metrics.
- Dashboards can be understood with a brief overview. Reports typically require more in-depth analysis.
- Dashboards are generally consumed on the web and provide high interactivity. Reports can be consumed on paper or on the web and provide little interactivity.
The most important thing to remember is that while reports and dashboards provide different functionalities and have different use-cases, there are scenarios where a report and dashboard could be interchangeable. In situations like that, it’s a matter of your own personal preference. Business intelligence and dashboarding features can help support both use-cases.
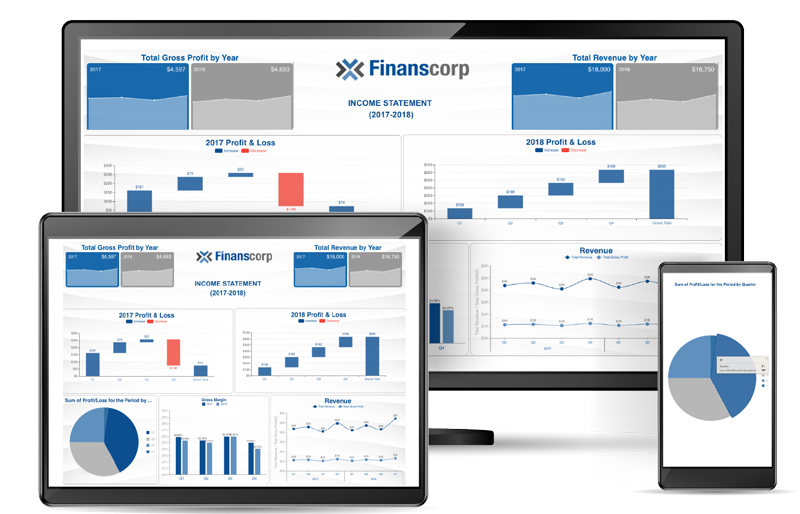
Business Intelligence Dashboard -Income Statement Dashboard
Who Should Create BI Dashboards?
One of the best things about BI dashboarding is that it is very accessible to all end-users, regardless of technical capability and knowledge. BI dashboards can be created by technical developers, or by non-technical business users. Business intelligence dashboard examples show how easy it can be for any user to create useful dashboards.
One factor in the creation of dashboards is the dashboard design tool being used; the simpler the tool, the more accessible it is for end-users to create meaningful and informative BI dashboards. Choosing the right bi dashboard solution ensures broader adoption.
Some factors that could make a dashboard design tool more difficult to use for business end-users could be a complicated UI (a messy layout and unclear design process), or an excessive feature set (a dashboard designer that has many unused or unclear features). Business intelligence dashboard tools should make dashboard design intuitive.
BI dashboards should be able to be created by even the most non-tech savvy end-user, which makes an intuitive, easy-to-use dashboard creation tool even more important.
How Are BI Dashboards Used?
BI dashboards can be used to convey all kinds of data to help drive the organization’s overall success through influencing decisions. With dashboard business intelligence software, organizations can empower users to interact with the data. Here is the ‘life-cycle’ of a BI dashboard.
Need for Dashboard/BI Project Established
This is the inception of the need for BI dashboarding. Typically, someone in the organization will indicate the need for at-a-glance data visualization to help monitor business performance and inform business decisions. Business intelligence and dashboarding platforms are often introduced at this stage.
Requirements for a BI dashboarding solution may include things like an easy-to-use designer, specific data connectors (such as MySQL or MongoDB), multi-tenant deployment support, or a customizable UI. Selecting the right bi dashboard solution can support all of these needs.
Solution Decision
After evaluating one or more business intelligence tools, you decide to choose the one that meets your requirements and fits your budget. This stage is when you would integrate the BI solution within your existing application or set it up as a stand-alone utility.
This could involve setting up your security provider for data governance, configuring user permissions, and other aspects of embedding a BI tool into your existing environment.
Additionally, you would set up data providers, data sets, and row-level security to only see the data they should access. Dashboard business intelligence software helps manage these aspects.
Dashboard Creation
Now that you have integrated a BI solution into your existing solution, set up data providers, and limited the data to each respective tenant, you and/or your end-users can get started with creating their first dashboard.
Traditional dashboards will typically be comprised of a multitude of data visualization components, such as Bar, Column, Pie, Doughnut, Area, Line, Tree, and Radar charts. Naturally, different BI tools will have different data visualization options- make sure the tool you choose has the charts you need! Business intelligence charts offer a range of visualization types.
Dashboard Consumption
Now that you or your end-users have created a BI dashboard, it is ready to be utilized. There is a dedicated view mode for the dashboards in most business intelligence tools, where end-users will look at the dashboard and interact with the data visualization components. Business intelligence dashboard tools enable this interactive experience.
End-users will typically log into a web portal of some kind to view their dashboard(s). More specifically, they can manipulate the dashboard’s charts to slice-and-dice the data in order to gather as much information as possible.
This is a key characteristic that distinguishes BI dashboards from BI reports.
When a dashboard is manipulated, it allows the end-user to retrieve the information they need to stay informed on business operations, report on business performance, or make data-driven decisions to further advance the organization’s success.
The above ‘dashboard life cycle’ is a simple use case. Depending on your organizational structure, industry, and preferences, a BI dashboarding project, solution, and subsequent dashboards may have a different type of life cycle(s). With the right bi dashboard solution, organizations can adapt to any workflow.
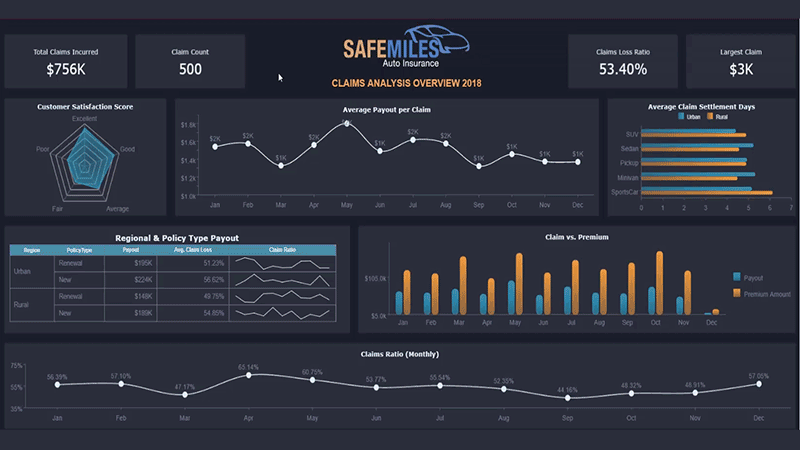
Business Intelligence Dashboard – Insurance Claims Dashboard
BI Dashboards – Key Takeaways:
- Usually web-based (whether on desktop, laptop, tablet, mobile phone, etc.)
- Interactive– users can manipulate the dashboard to better reflect the ‘story’ behind the data
- Summarized data- KPIs, metrics, charts, etc. No lengthy tables, or extensive data reporting
Benefits of BI Dashboards and Other Considerations
Business intelligence dashboards provide countless benefits to different roles in many different industries. Business intelligence dashboard examples demonstrate these advantages.
For example, effective data visualization improves manufacturing processes by assessing the profit contribution of individual segments, product lines, and customers through the information that reveals the overall margin spread. Business intelligence key performance indicators help users stay focused on what’s important.
Insurance dashboards provide underwriting loss assessments, fraud analysis, and much more.
BI dashboards prove valuable in many areas to end-users of all types. Technical dashboard consumers can work with the data behind the dashboard to generate custom queries or filter the data from the data level.
On the other hand, non-technical users can interact with the dashboard itself by filtering the visualization components on the dashboard level.
Regardless of technical skill, all dashboard end-users can stay in the know with up-to-date data, analytical metrics, KPIs, and other valuable data points presented by BI dashboards. Business intelligence charts help visualize these points clearly.
BI dashboards can be used to monitor business performance by providing top-level summary data, such as daily, monthly, and yearly sales, top-selling products, or the best-performing store. Dashboard business intelligence software enables real-time monitoring for all these metrics.
Dashboards can also be used to discover viable business opportunities by performing basket analyses on sales data, capitalizing on qualitative successes, identifying weak points in a sales cycle, or identifying key success factors. The right bi dashboard solution will empower teams to unlock new insights.
One of the greatest aspects of dashboarding is the flexibility of where you view it. Whether on a desktop, laptop, smartphone, or another device, a dashboard viewer should feature responsive visualization; that is, being able to adjust according to the platform it is rendered on.
If you create a dashboard on your laptop, you want the dashboard end-user viewing on their mobile device to see the same dashboard you created! Business intelligence and dashboarding features ensure a seamless experience across all devices.
Luckily, most modern BI tools will have this functionality.
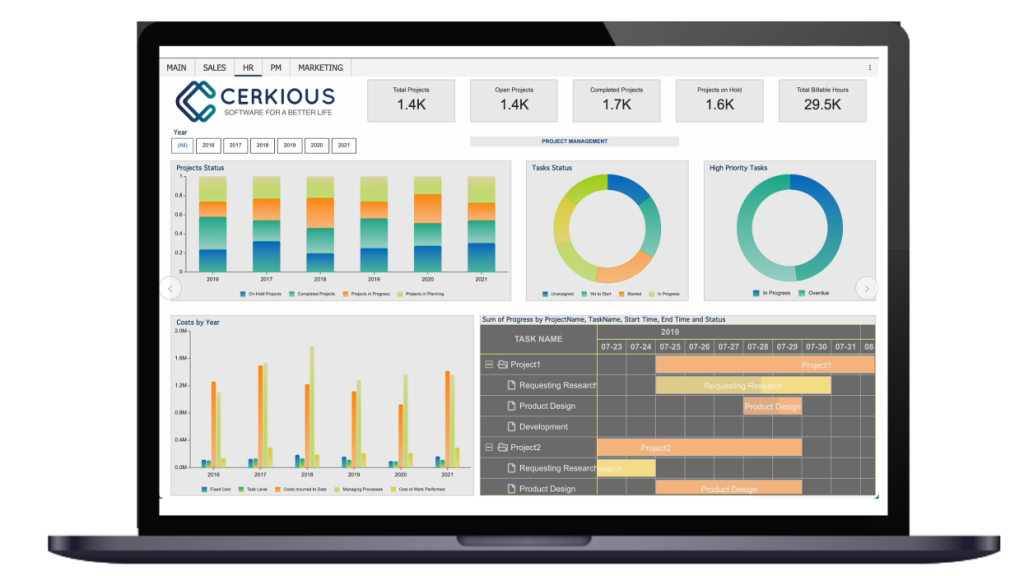
Business Intelligence Project Management Dashboard
Reasons Why You Should Use BI Dashboards:
- Monitor business performance
- Highlight key data points (KPIs)
- Identify opportunities
- Discover the story behind the data
- Make data-driven informed decisions
- Enables the use of embedded self-service BI applications by industry analysts
As you’ve been reading, you may have wondered whether BI dashboards can be beneficial to your organization specifically. Regardless of what industry you belong in, the answer is a resounding yes!
BI dashboards can be beneficial to all organizations.
The benefits that BI dashboards provide can be applied to organizations in finance, retail, manufacturing, technology (SaaS, IT, etc.), insurance, healthcare, education, government, and more.
Learn how to create a BI dashboard in under 5 minutes.
By now, you should have a complete understanding of what a BI dashboard is, how you can utilize them, and, most importantly, why you should use them. Business intelligence dashboard examples and business intelligence charts are a great starting point.
While BI dashboards provide many benefits, it is up to you to find the perfect solution for your dashboarding requirements. Data is king in today’s world, but we can take full advantage of it with modern technology using business intelligence dashboards and the best bi dashboard solution for your needs.
FAQ: Business Intelligence Dashboards
1. In what ways do business intelligence dashboards assist organizations in gathering and managing data?
Business intelligence dashboards centralize data from multiple sources, making collection and analysis seamless. They provide real-time access to critical metrics, allow teams to track KPIs efficiently, and present information visually for clarity. This ensures that stakeholders have up-to-date, actionable insights to drive better decision-making across the organization.
2. What are the key steps involved in building a business intelligence dashboard?
To build a BI dashboard, follow these steps:
- Select your BI dashboard software – Choose a tool that aligns with your data needs and visualization goals.
- Connect your data sources – Link databases, spreadsheets, and cloud platforms.
- Define KPIs and visualizations – Identify critical metrics and select charts or graphs.
- Design your layout – Arrange visuals and filters for clarity and ease of navigation.
- Enable interactivity – Add filters, drill-downs, and conditional formatting for deeper analysis.
- Share with users – Publish the dashboard to foster collaboration and monitoring.
3. Do business intelligence dashboards enable forecasting and trend analysis for future planning?
Yes. BI dashboards allow organizations to forecast by analyzing historical data and identifying key patterns. With built-in analytics, teams can anticipate market shifts, recognize growth opportunities, and detect potential risks. This foresight empowers leaders to plan strategically and adapt quickly to changing business environments.
4. What are the essential features of an effective business intelligence dashboard?
An effective BI dashboard should include:
- User-friendly design – Clear layouts, easy navigation, and minimal clutter.
- Relevant KPIs – Focus on metrics that matter most for each role or department.
- Clear visualizations – Use graphs, charts, and tables to simplify complex data.
- Customization – Let users tailor views, filters, and metrics to fit their needs.
- Real-time updates – Ensure decisions are based on the most current data.
- Interactive tools – Enable drill-downs, comparisons, and filtering options.
- Scalability – Support growing teams and integrate new data sources smoothly.
5. How do BI dashboards improve collaboration within an organization?
Dashboards create a single source of truth that eliminates silos and miscommunication. Teams can share live dashboards across departments, ensuring everyone works with the same data. Built-in collaboration features such as annotations, scheduled reports, and user-specific views enable cross-functional groups to align on goals and monitor progress in real time.
6. Can BI dashboards integrate with other enterprise systems?
Yes. Most enterprise-grade BI dashboard tools integrate with ERP systems, CRMs, cloud applications, and custom databases. This connectivity streamlines workflows, reduces manual reporting, and allows organizations to view operational, financial, and customer data all in one place. With APIs and connectors, new systems can be added as business needs evolve.
7. How do business intelligence dashboards support decision-making in real time?
Real-time dashboards empower leaders to respond to challenges as they happen. By pulling live data feeds, dashboards display up-to-the-minute KPIs on sales, operations, or supply chain performance. This visibility helps organizations spot anomalies, resolve issues faster, and capitalize on opportunities without waiting for end-of-month reports.

Ethan Conner
As a Technical Account Manager w ith the Wyn Enterprise team, Ethan loves the collaborative, team-oriented culture. In his spare time, he enjoys playing guitar and drums, learning new technologies, and reading. You can find him on LinkedIn.


Loved by industry
experts and real users