Visualizing Data with a Custom Restaurant Floor Plan Control
In this article, we showcase the benefits and usage of the Floor Map control using a restaurant’s sample data.
15 Sep 2025
How to Use Business Intelligence (BI) to Improve Organizational Alignment
Learn how to use business intelligence tools to improve your organizational alignment.
Create Custom Visualizations for BI Dashboards
New custom data visualizations are available for Wyn Enterprise BI dashboards.
How Self-Service Analytics Can Transform Your Organization—Today and the Future Ahead
With the increasing trend in enterprises becoming data-driven, business intelligence is becoming more integrated into business processes and is more vital to the success of an organization. Here, we discuss 5 things to consider when evaluating a BI solution.
12 Sep 2025
How to Create a Business Intelligence Dashboard in 5 Minutes (Video)
In this video tutorial, we’ll create a BI dashboard in under 5 minutes.
10 Benefits of Embedded Business Intelligence
Here we discuss how to get a faster time to insights, enhanced collaboration, and create a data-driven culture with modernized embedded BI.
11 Sep 2025
A Guide to Manufacturing BI Dashboards
A manufacturing BI dashboard aggregates factory data and turns it into actionable information. Manufacturing BI dashboards aggregate data from ERP, MES, and other systems and process it to help maximize resource utilization, output, and target attainment demands.
How to Track Profit and Loss with a CFO Business Intelligence Dashboard
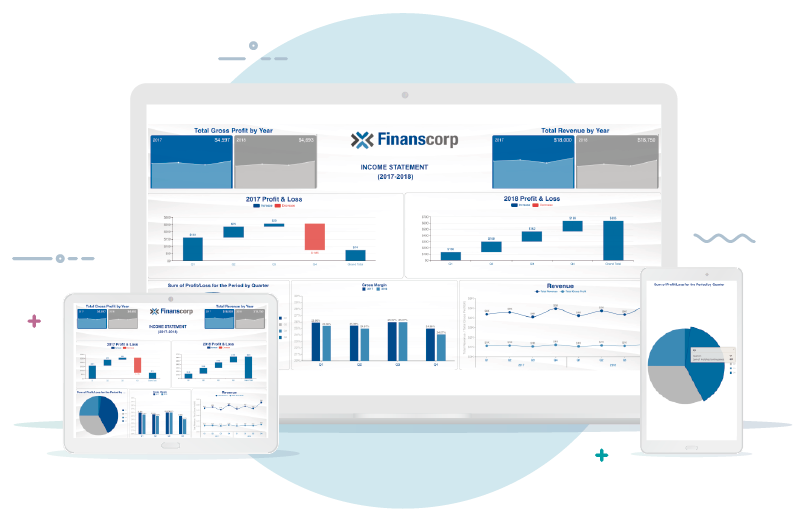
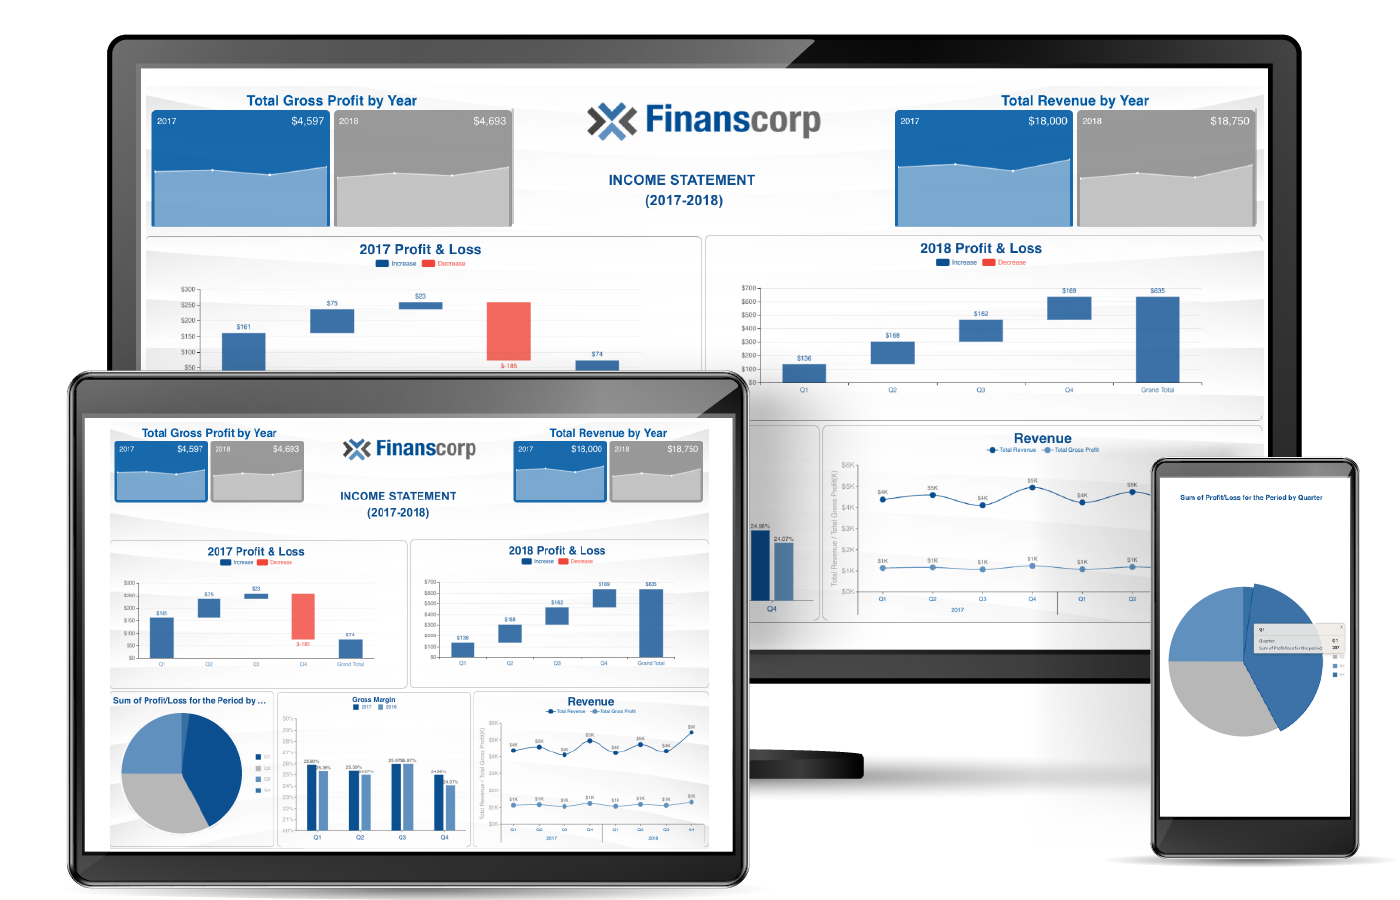
With a profit and loss CFO dashboard, you can track profit margin, operating profit, expenses, profits per region, and location. Visualize critical financial measures such as COGS, net sales, net profit, and profit vs. spending per region.
A Guide to CEO Dashboards
A CEO dashboard provides executives with high-level KPIs and metrics at a glance to monitor business performance to make agile, data-driven decisions. Here, we will highlight the essential KPIs and metrics needed for leadership.
The Top Benefits of Business Intelligence (BI) for the Pharmaceutical Industry
Learn about the top benefits of a business intelligence solution for the pharmaceutical industry.
A Guide to Ad Hoc Reporting (Tips and Best Practices)
Ad hoc reporting is a business intelligence process where non-technical end-users can generate BI reports without the need from IT. Ad hoc reporting is a component of BI that helps users make data-driven decisions more accurately. Here’s a complete guide to ad hoc reporting, best practices, and industry use cases.
28 Aug 2025
A Complete Guide To Business Intelligence Dashboards
A BI dashboard is an interactive visualization method for displaying different types of data for business operations on various scales. The types of data typically found in BI dashboards are analytics metrics, key performance indicators (KPIs), and other data points that play a role in decision-making.
Business Intelligence Dashboards for Manufacturing: Overall Equipment Effectiveness
Overall equipment effectiveness (OEE) measures the productivity of a manufacturing organization. Here, we’ll create an OEE dashboard to identify the percentage of productive manufacturing time for an organization operating in multiple shifts.
06 Aug 2025
Data Visualization in the Insurance Industry
From interactive dashboards and reports visualizing claims analysis, underwriting loss assessment dashboards, and fraud analysis to agent performance reports, business intelligence provides insurance companies with more in-depth insights into their data.
The Role of Business Intelligence in the Supply Chain
Business intelligence enhances supply chain management by making real-time data analytics accessible. Here, we’ll discuss how BI can provide real-time insights into supply chain emerging risks, inefficiencies, and anomalies, allowing organizations to quickly isolate and resolve potential problems.
04 Aug 2025